cat no | 06-1001-0000
Cryopreserved human iPSC-derived atrial cardiomyocytes generated by directed differentiation that are ready for experiments in days
Physiologically-relevant model for atrial-selective electrophysiology and pharmacology
Human iPSC-derived atrial cardiomyocytes
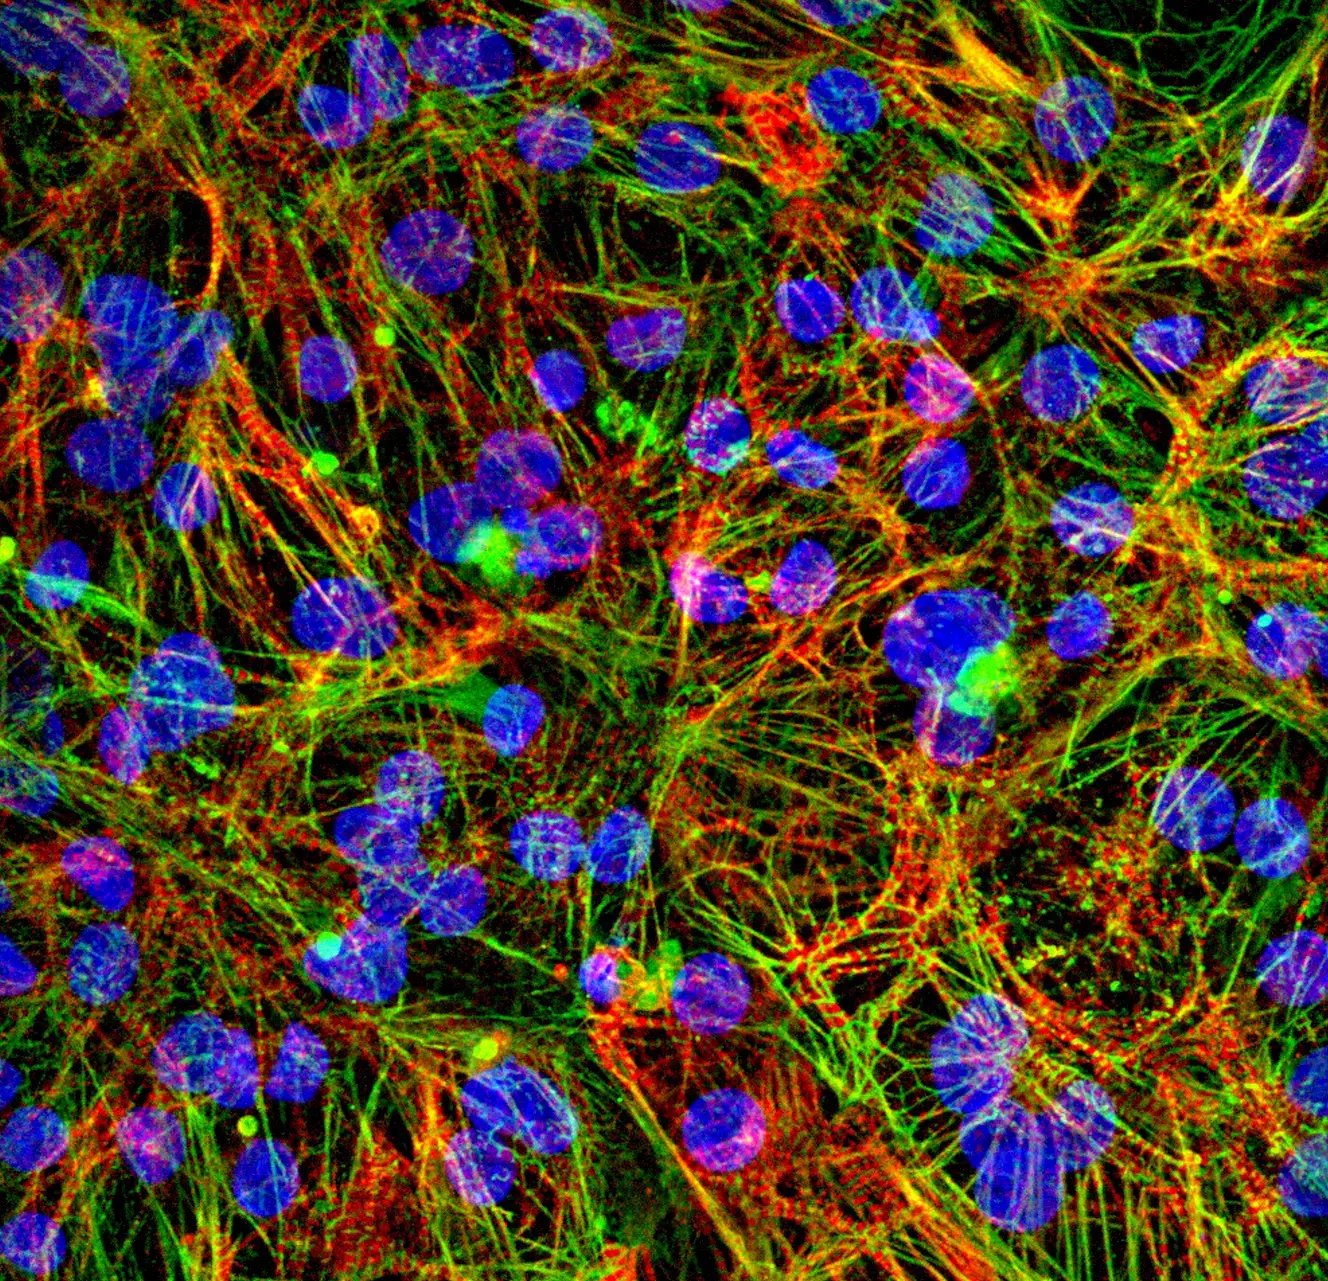
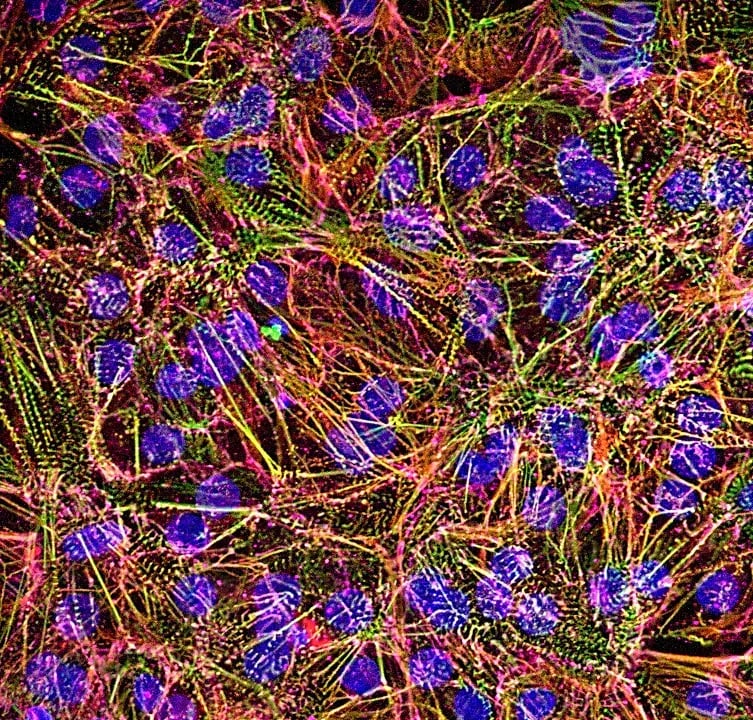
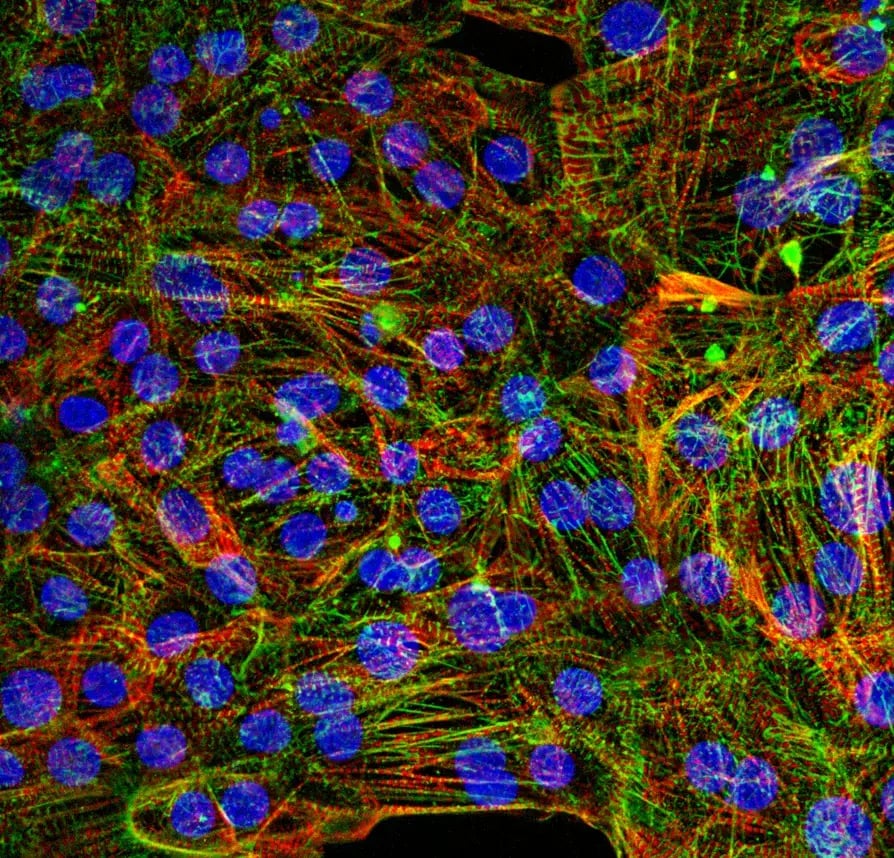
Immunofluorescent staining of human iPSC-derived Atrial Cardiomyocytes: cTNT (red) confirms cardiac identity, ACTN2 (green) highlights sarcomeric organisation, and DAPI (blue) labels nuclei. The merged image demonstrates widespread cardiac marker expression and organised sarcomeric structures. 60x magnification.
Atrial Cardiomyocytes show spontaneous, synchronised beating
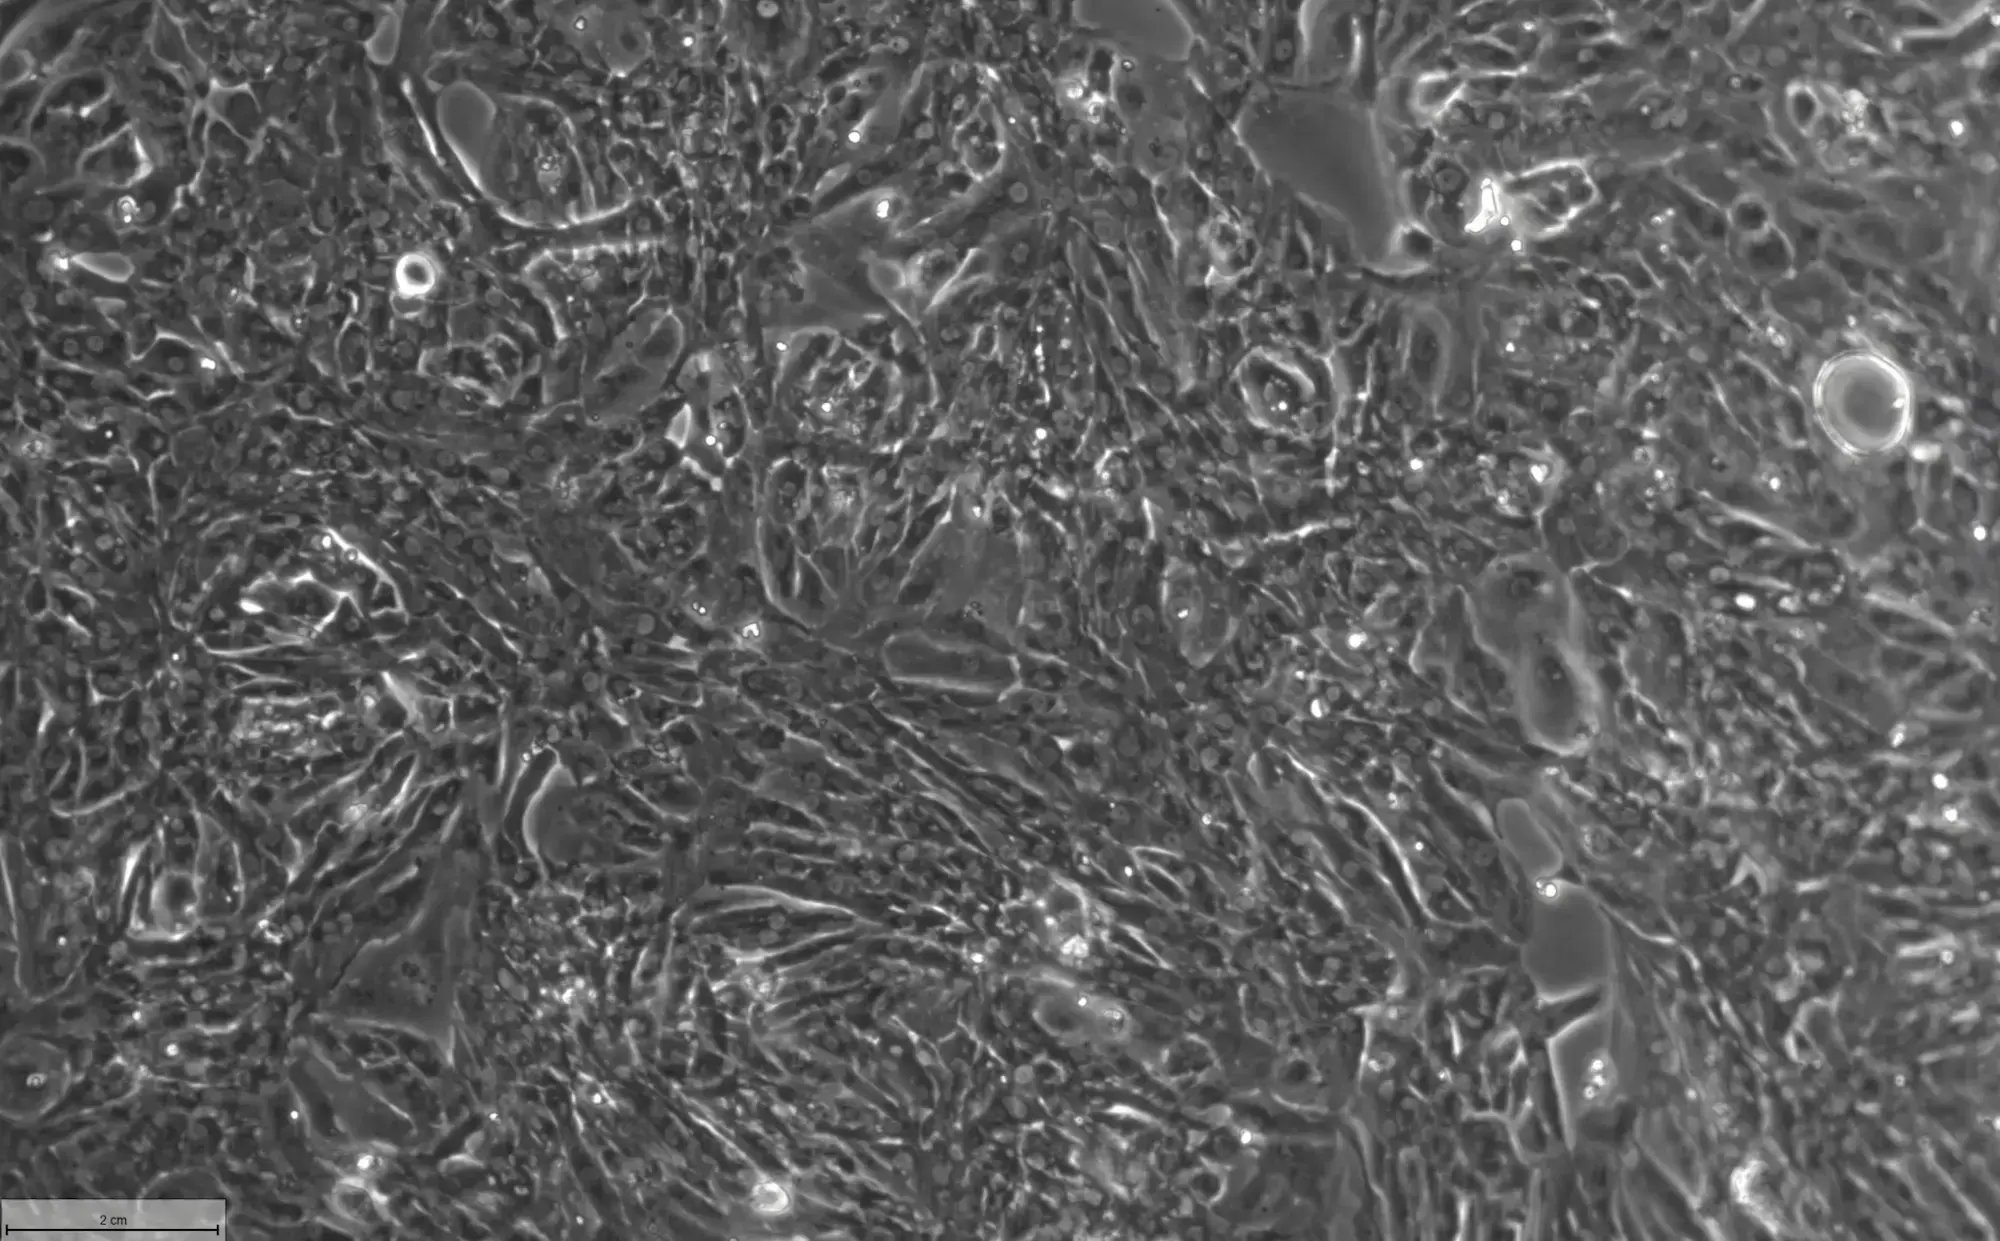
Video showing spontaneous beating of Atrial Cardiomyocytes cultured in Matrigel-coated flasks; representative of day 20 post-thaw; 10x magnification.
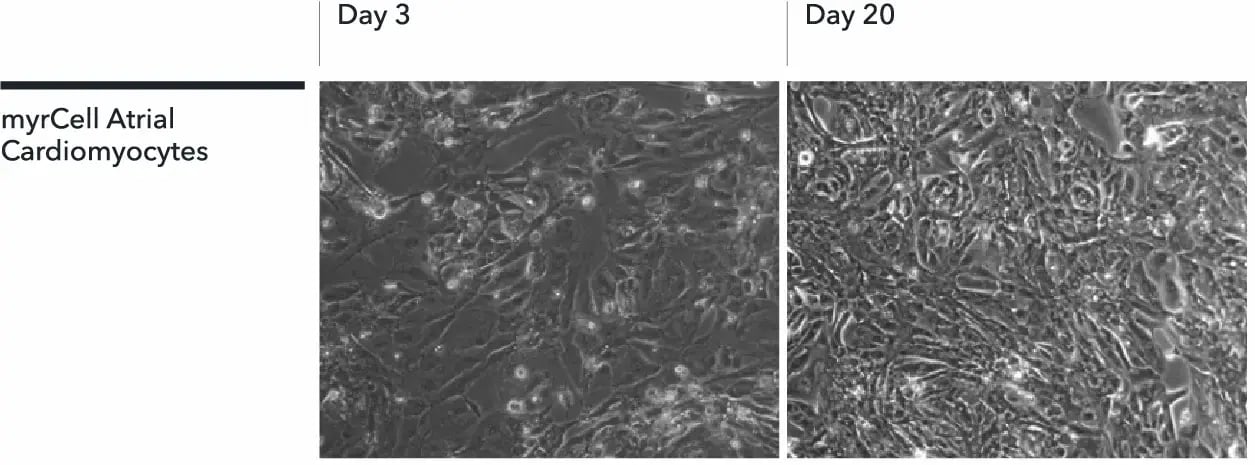
Atrial Cardiomyocytes form confluent, electrically coupled monolayers within 7 days
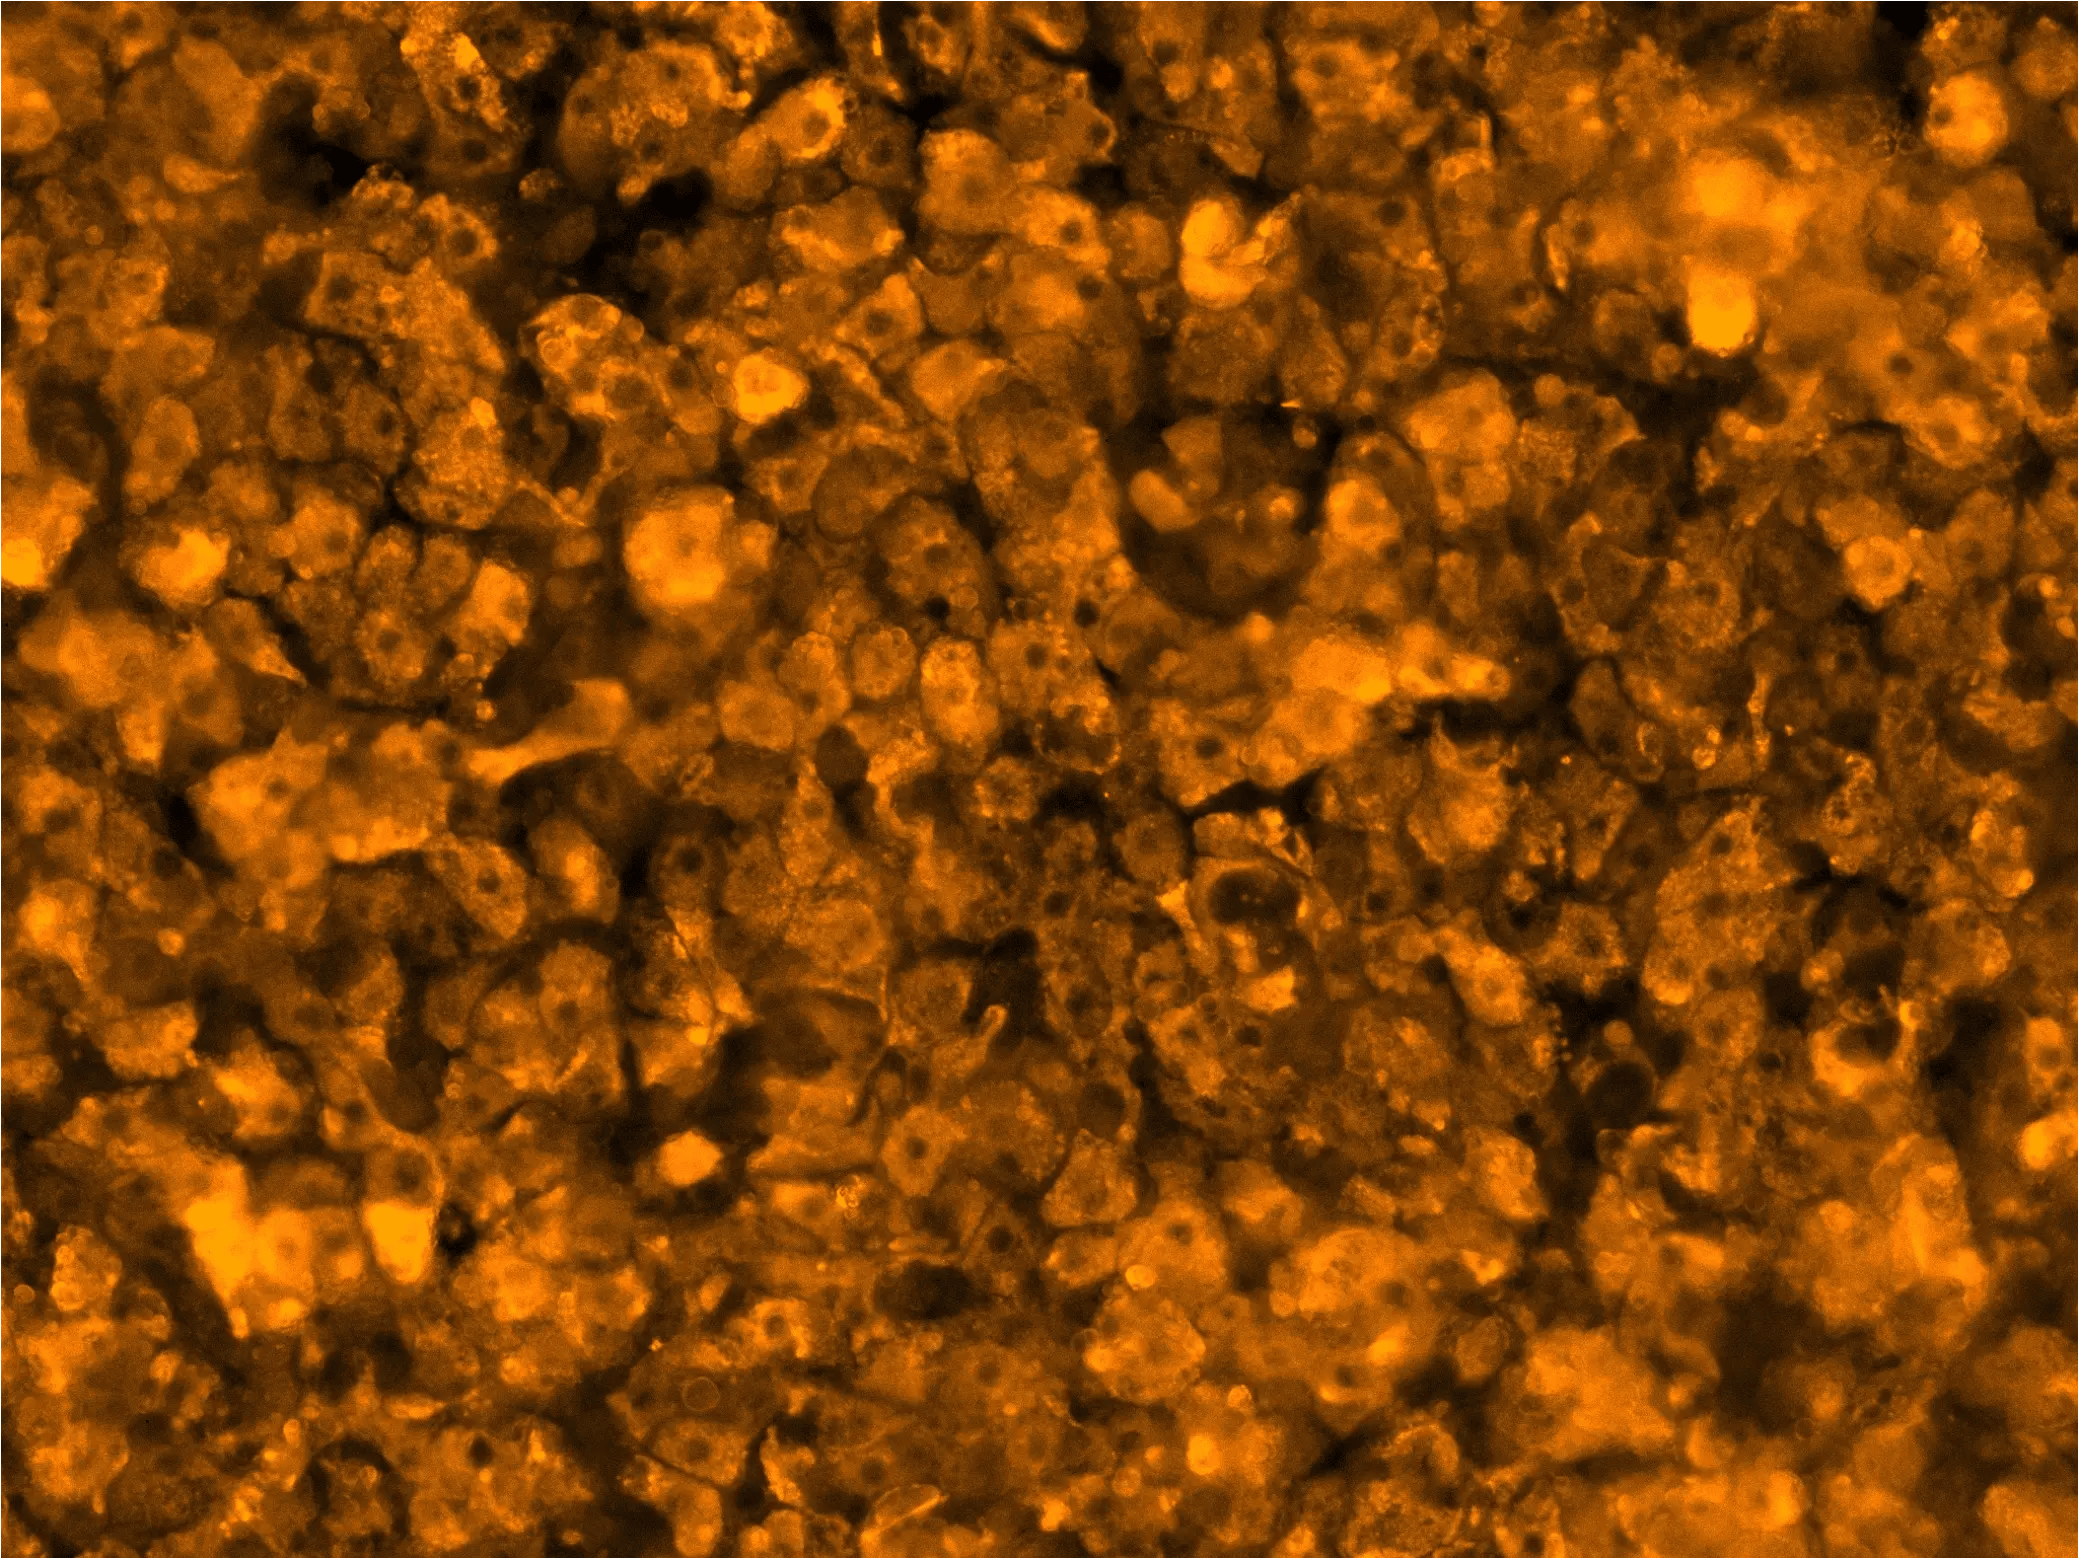
Brightfield images showing the attachment of Atrial Cardiomyocytes cultured on Matrigel-coated flasks. Cells form confluent, electrically coupled monolayers and develop spontaneous, synchronised beating following thawing; images acquired at day 3 and day 20 post-thaw (10x objective).
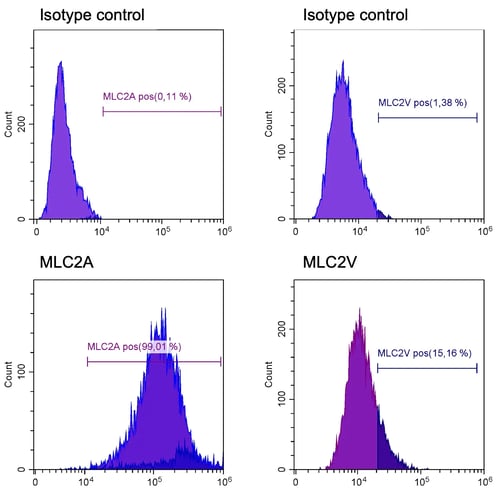
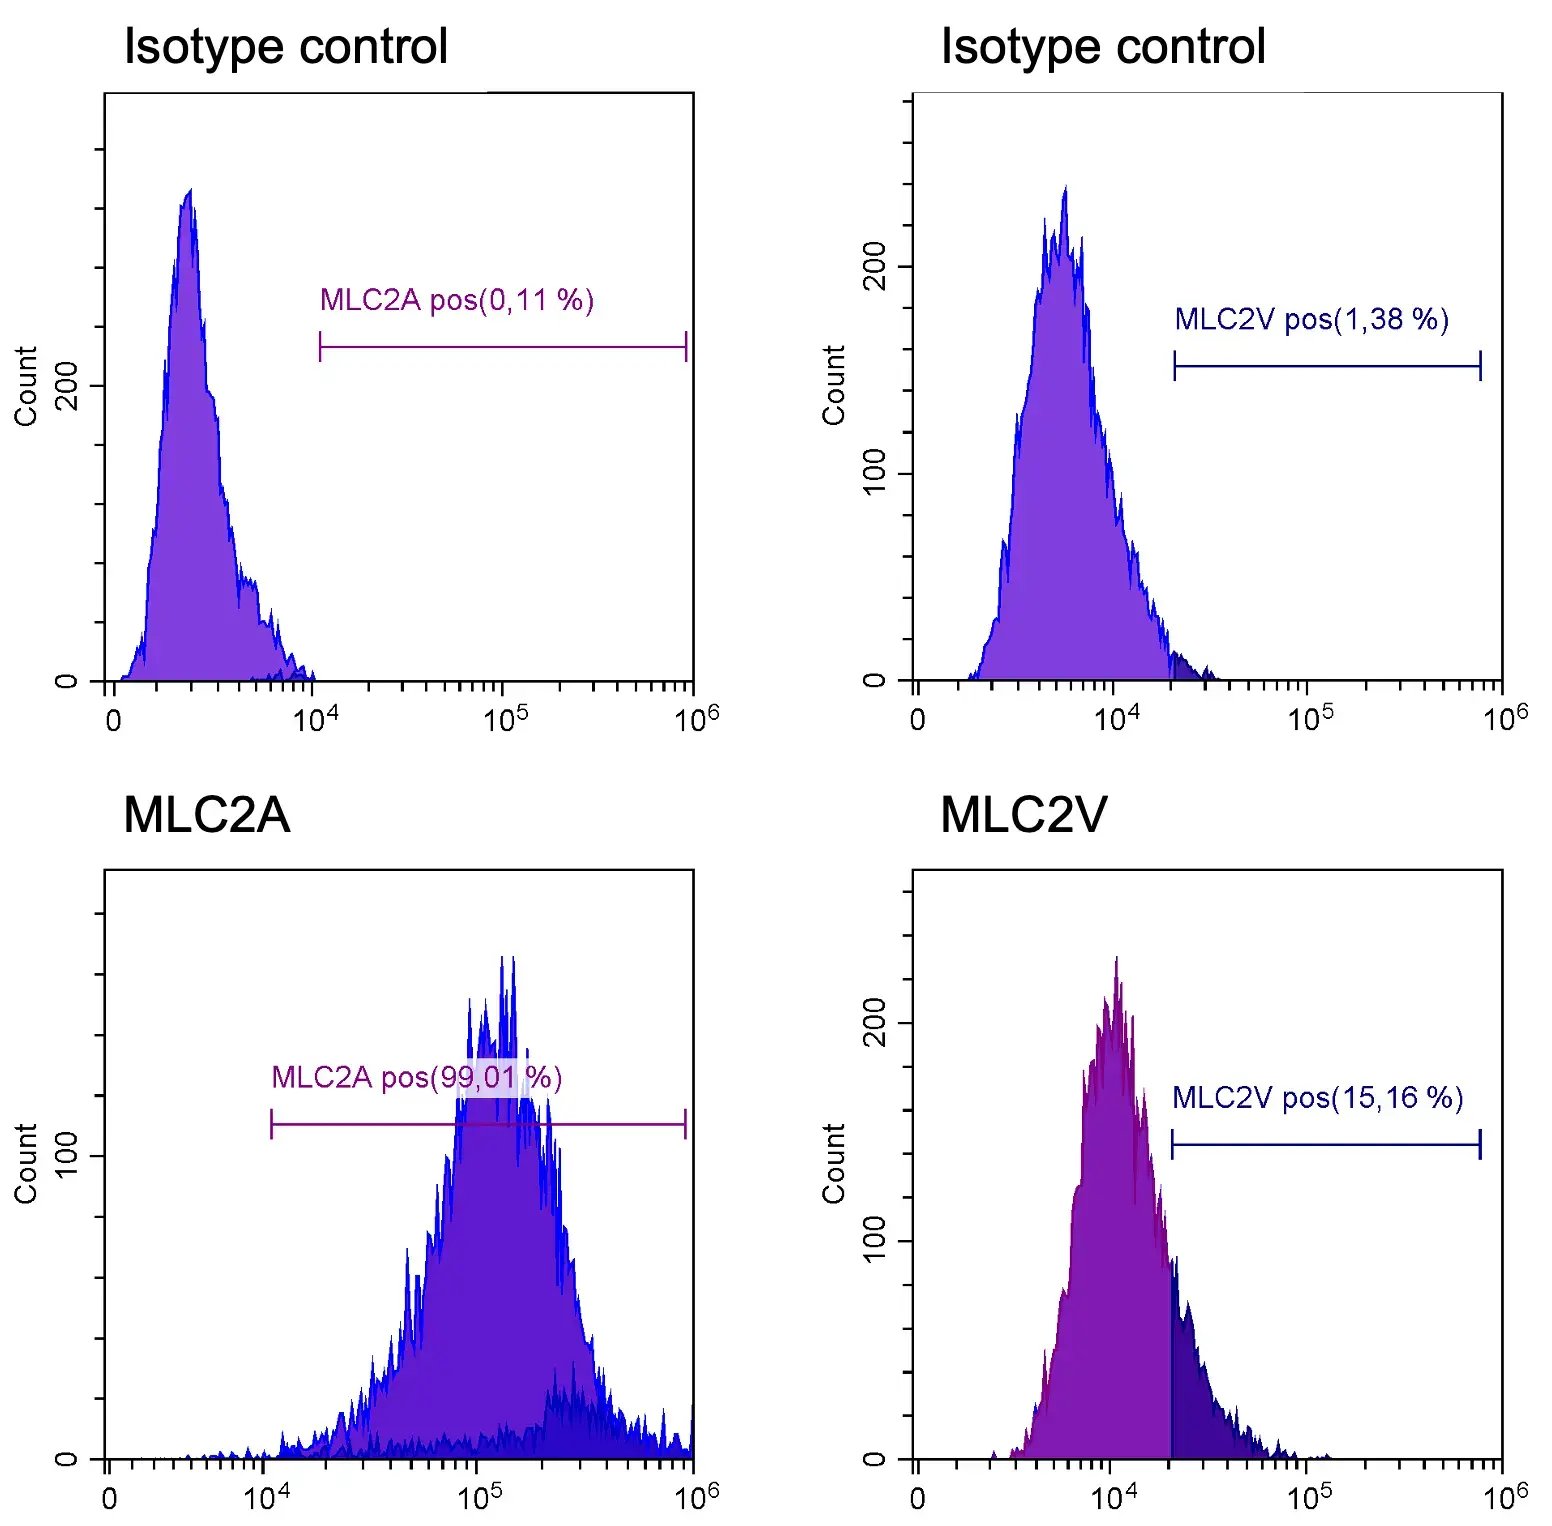
Atrial Cardiomyocytes exhibit a distinct atrial phenotype at day 10 post-thaw
Flow cytometry analysis at day 10 post-thaw confirms purity and atrial phenotype. The population demonstrates high expression of the atrial marker MLC2A and low expression of the ventricular marker MLC2V, verifying a predominantly atrial phenotype. Isotype controls were used for gating.
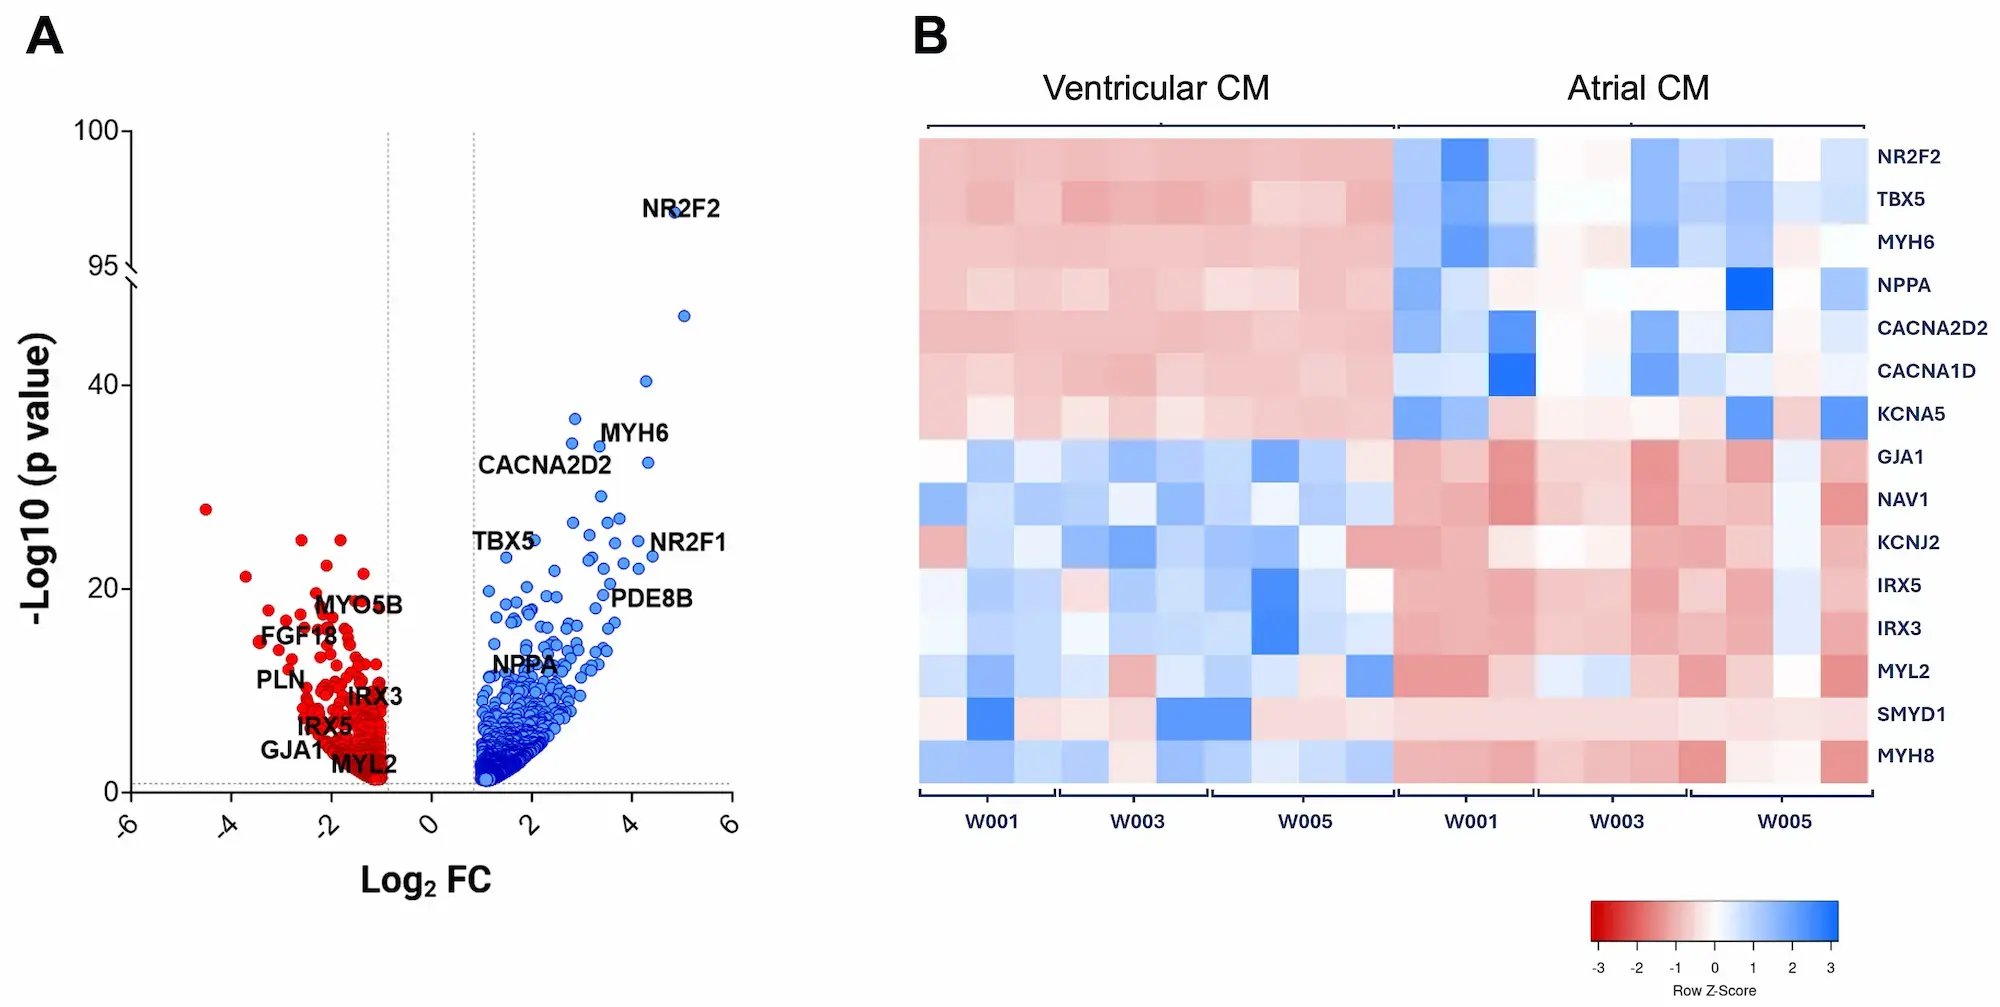
RNA sequencing confirms distinct ventricular and atrial phenotypes
RNA sequencing (RNA-seq) demonstrates robust chamber-specific differentiation of Ventricular and Atrial Cardiomyocytes (CM). Differential gene expression and hierarchical clustering reveal distinct ventricular and atrial transcriptomic signatures, confirming reproducible lineage specification and molecular identity across independent differentiation batches. The cells were harvested for RNA-seq at day 7 post-thaw.
A. Volcano plot showing differential gene expression. The x-axis represents log2 fold change (FC) and the y-axis shows -log10 (p value) for each gene. Genes with significant upregulation (blue) or downregulation (red) are labeled, with prominent cardiac-related genes.
B. Heatmap depicting the relative expression (row Z-score) of selected cardiac-related genes across samples; gene names are listed on the right. The heatmap reveals distinct clustering patterns between conditions. The colour scale ranges from -3 (red, indicating lower expression) to +3 (blue, indicating higher expression).
Data were generated from three wild-type iPSC lines (W001, W003, W005) differentiated into both ventricular and atrial cardiomyocytes across 3–4 independent batches. For each line and batch, three technical replicates were pooled prior to sequencing. Ventricular Cardiomyocytes, cat. no. 02-1001-0000, and Atrial Cardiomyocytes, cat. no. 06-1001-0000, are generated from iPSC line W001. Please enquire for further information about iPSC lines W003 and W005.
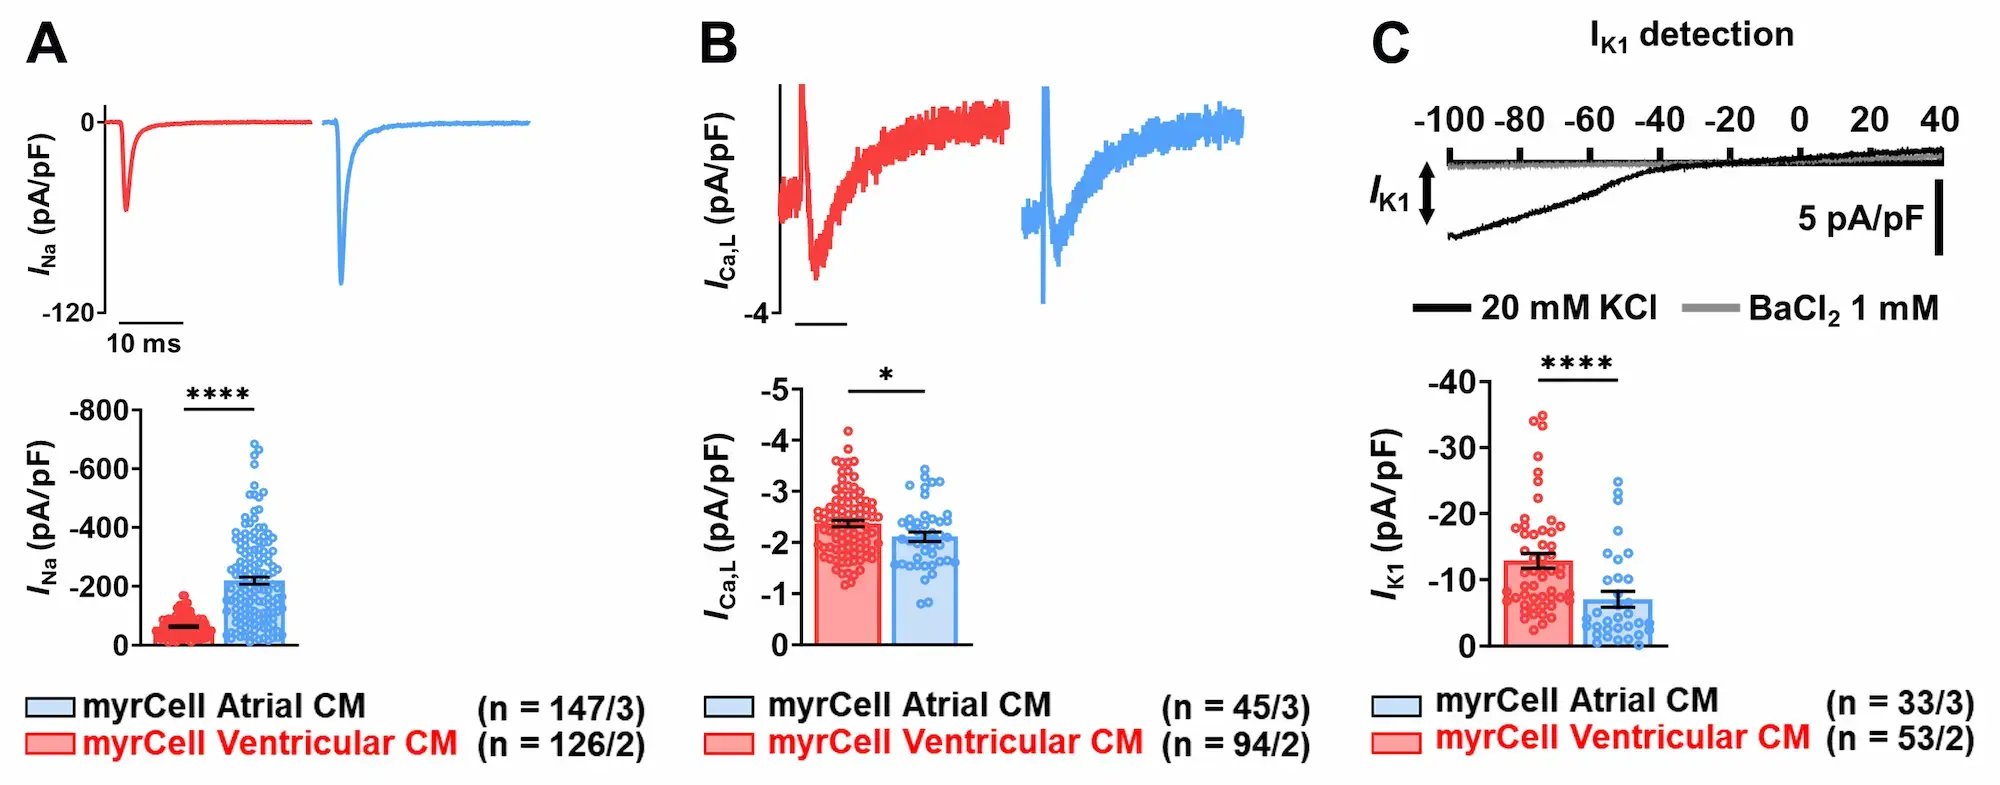
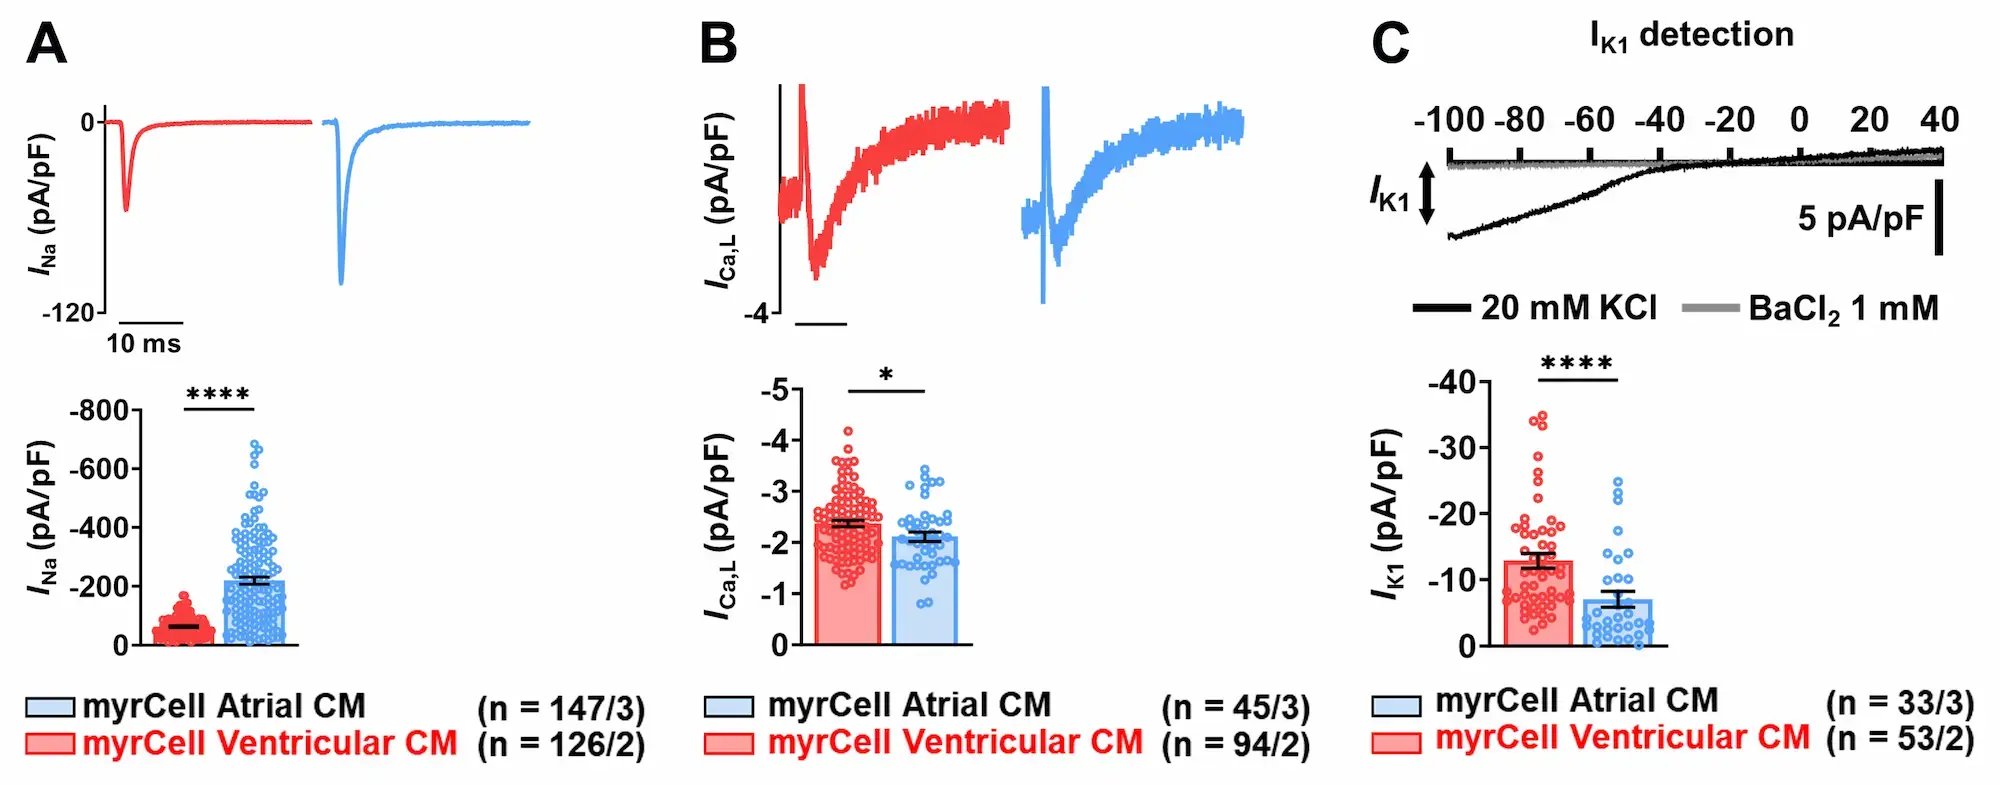
Robust functional expression of key cardiac ion channels confirmed by automated patch-clamp analysis
Automated patch-clamp analysis confirms robust expression of key cardiac ion channels in Ventricular (red) and Atrial (blue) Cardiomyocytes (CM).
Representative INa current traces with mean ± SEM peak INa amplitude and I-V curve (A).
Representative ICa,L current traces with mean ± SEM peak ICa,L amplitude and I-V curve fitted with Boltzmann-Ohm curve (B).
Representative trace showing basal inward rectifier current (IK1) in the presence of 20 mM KCl (black) and BaCl2 (grey) and mean ± SEM IK1 at -100 mV (C).
Measurements were acquired from iPSC-derived cardiomyocytes cultured for 50 days post-thaw. Comparisons were made using unpaired Student’s t-test, Mann Whitney’s U-test vs. Ventricular. ****p<0.0001, *p<0.05; n/N = iPSC-CM/batches.
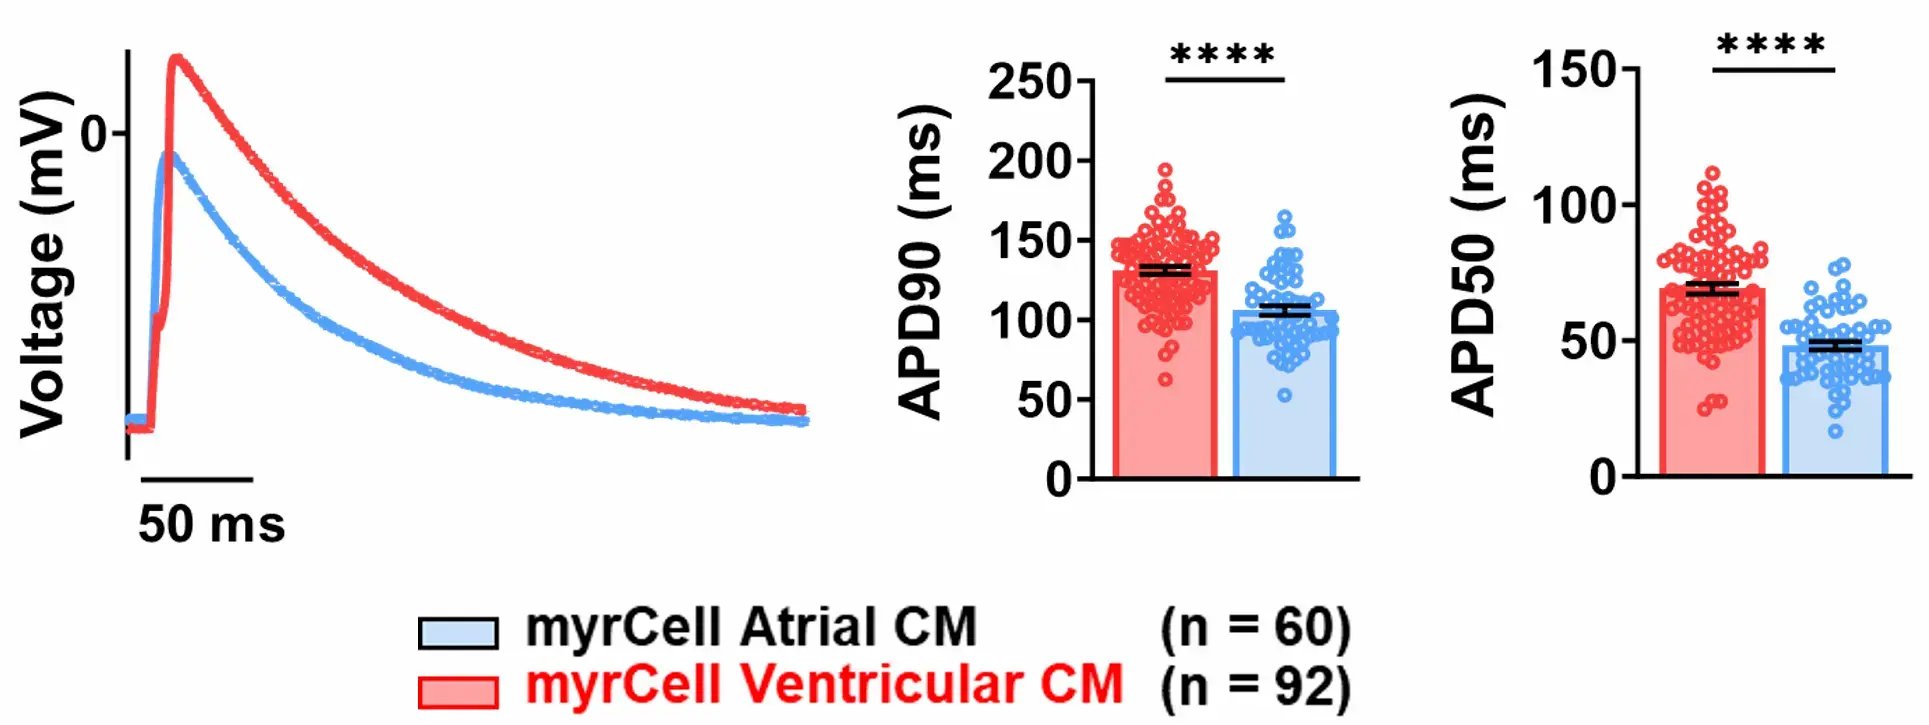
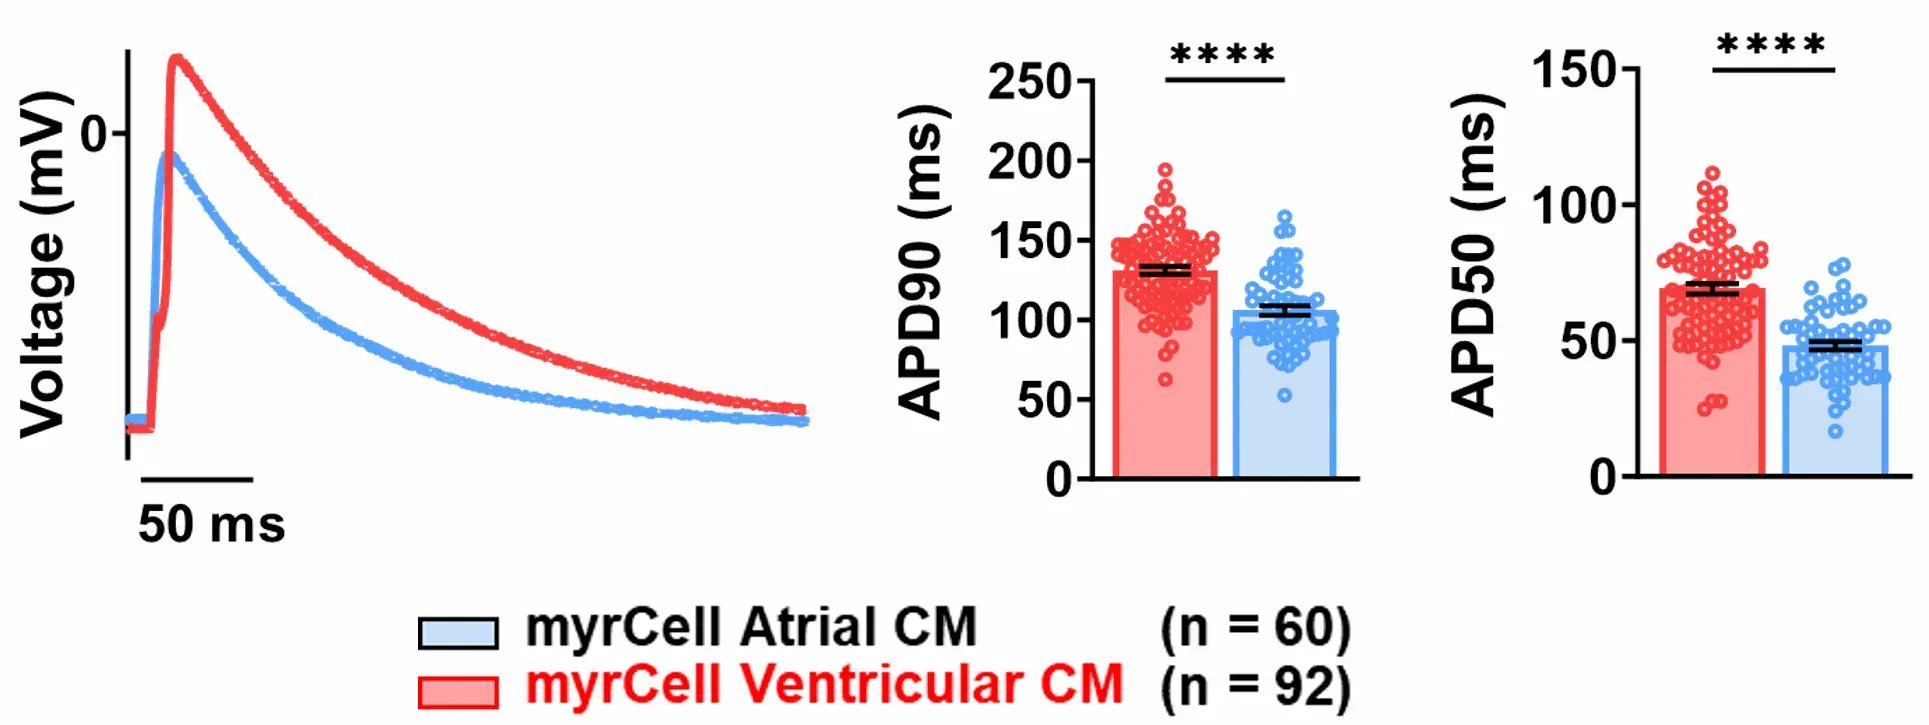
Mature electrophysiological phenotypes demonstrated by action potential recordings
Representative action potential (AP) recordings demonstrate mature ventricular and atrial phenotypes.
Representative membrane voltage (mV) traces showing atrial and ventricular triggered APs in Atrial (blue) and Ventricular (red) Cardiomyocytes (CM) (left).
AP duration at 90% (APD90) and 50% (APD50) repolarisation as mean ±SEM (centre and right).
Measurements were acquired from human iPSC-derived cardiomyocytes cultured for 7 days post-thaw. Comparisons were made using unpaired Student's t-test, Mann Whitney's U-test vs. Ventricular. ****p<0.0001; n = iPSC-CM from one batch.
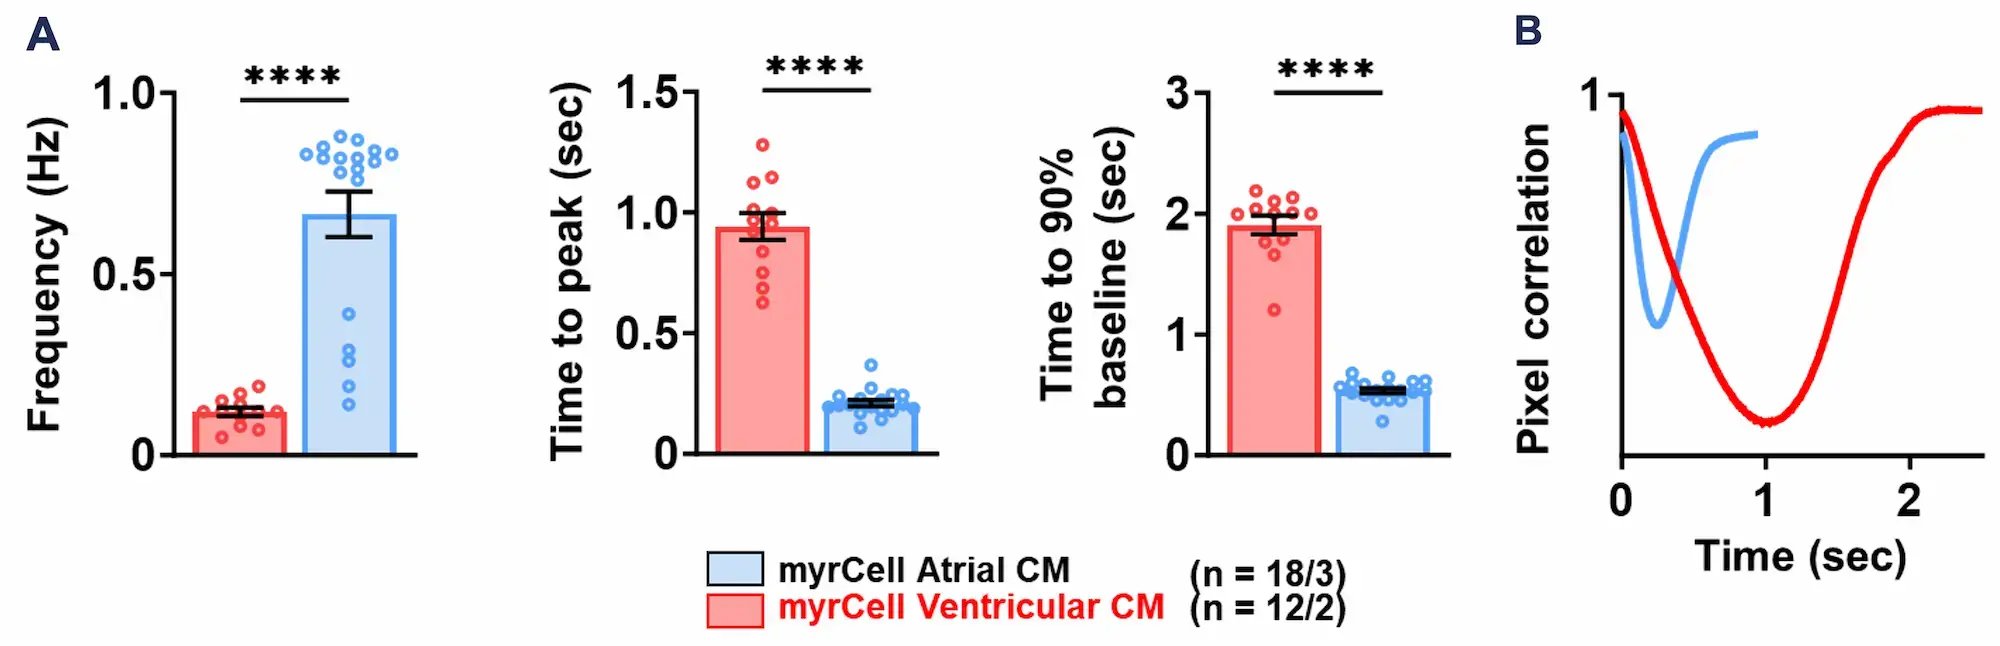
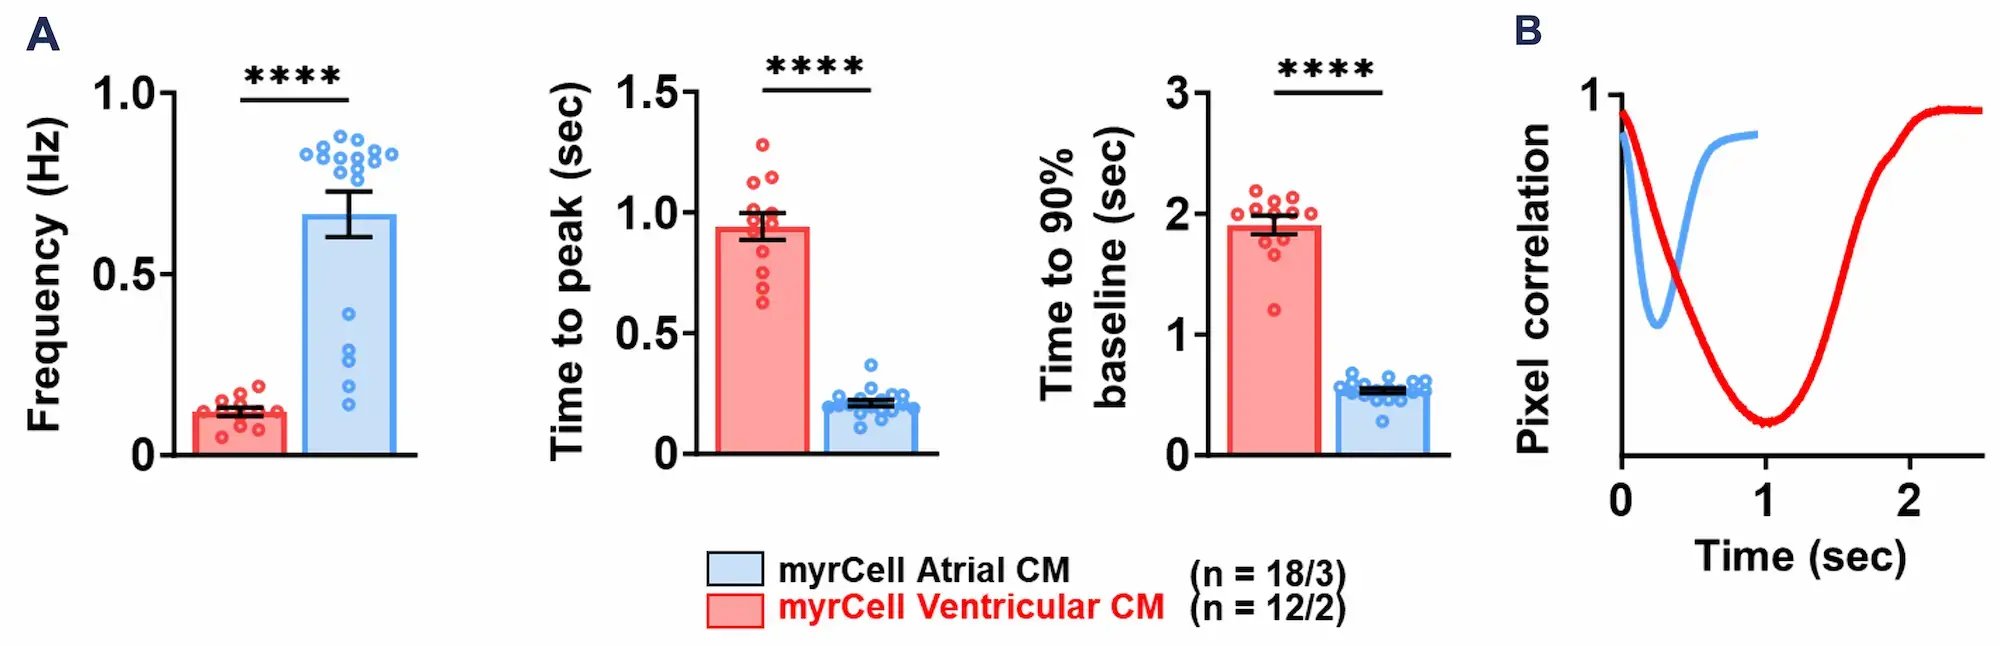
Chamber-specific contractile properties confirmed by quantitation of contractile dynamics
Contraction analysis using CytoMotion label-free, image-based motion detection software (IonOptix), confirms chamber-specific contractile function of Ventricular (red) and Atrial (blue) Cardiomyocytes (CM).
Frequency (Hz), time to peak (sec), and time to 90% baseline (sec) showed as mean ± SEM (A).
Representative traces showing contraction of human iPSC-derived cardiomyocytes monolayers as mean ± SEM (B).
Measurements were acquired from iPSC-derived cardiomyocytes cultured for 50 days post-thaw. Comparisons were made using unpaired Student's t-test, Mann Whitney's U-test vs. Ventricular. ****p<0.001; n/N = measurement ROI/batches.
Atrial Cardiomyocytes express key cardiac specific markers
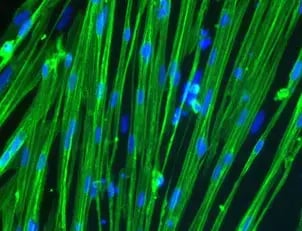
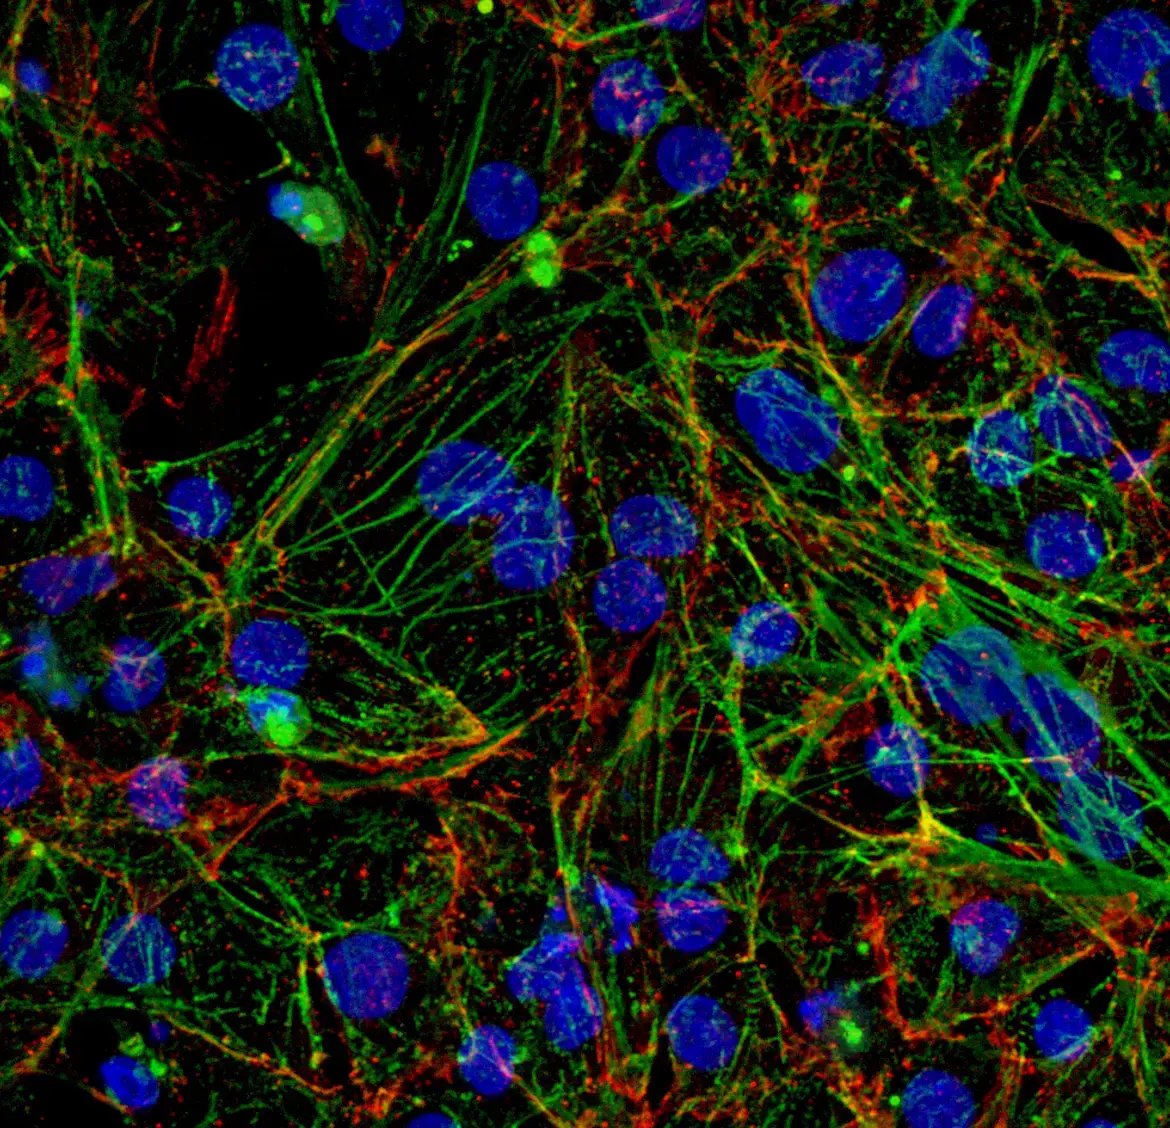
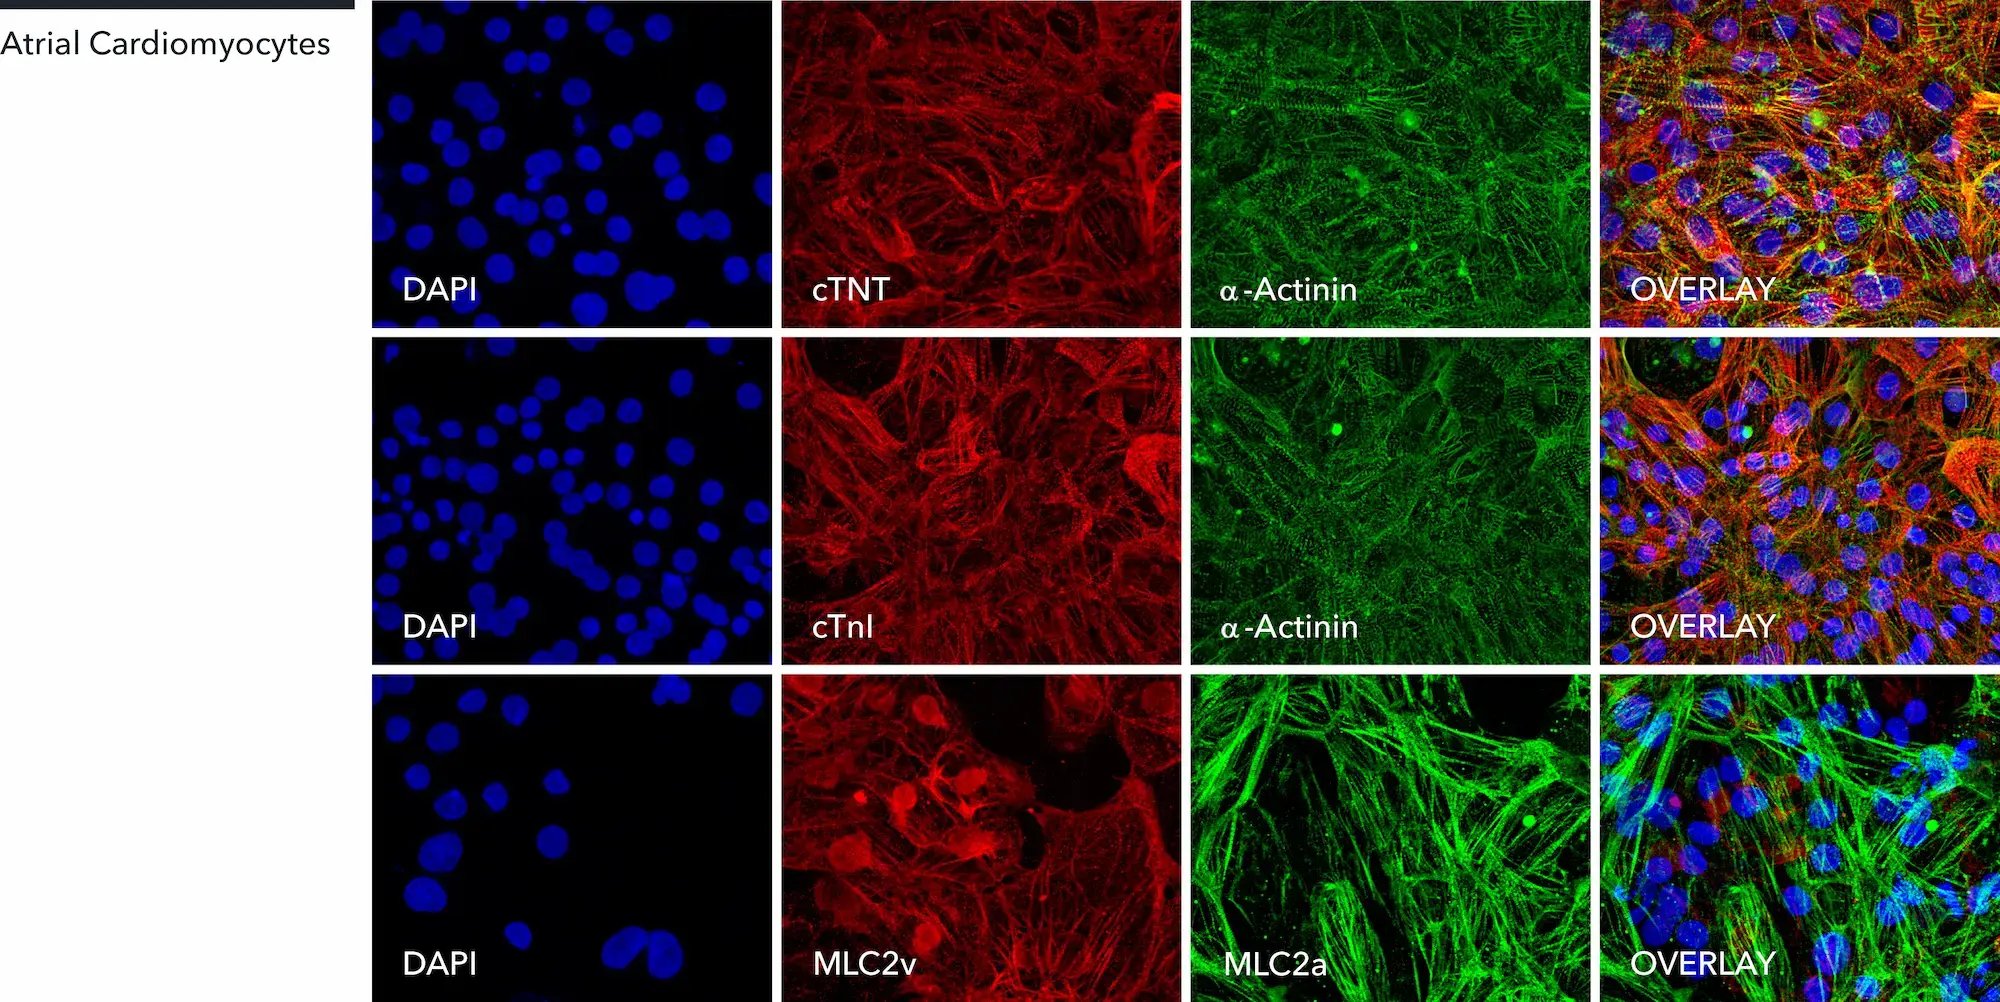
Immunofluorescent staining of human iPSC-derived Atrial Cardiomyocytes at day 10 post-thawing showing the presence of key cardiac and atrial-associated markers α-actinin, cardiac troponin T (cTNT), cardiac troponin I (cTnI) and Myosin regulatory light chain 2, atrial isoform (MLC2a). The staining demonstrates organised sarcomeric α-actinin and cardiac marker expression, together with MLC2a expression consistent with atrial cardiomyocyte identity; 60x magnification.
Atrial Cardiomyocytes express key cardiac specific markers
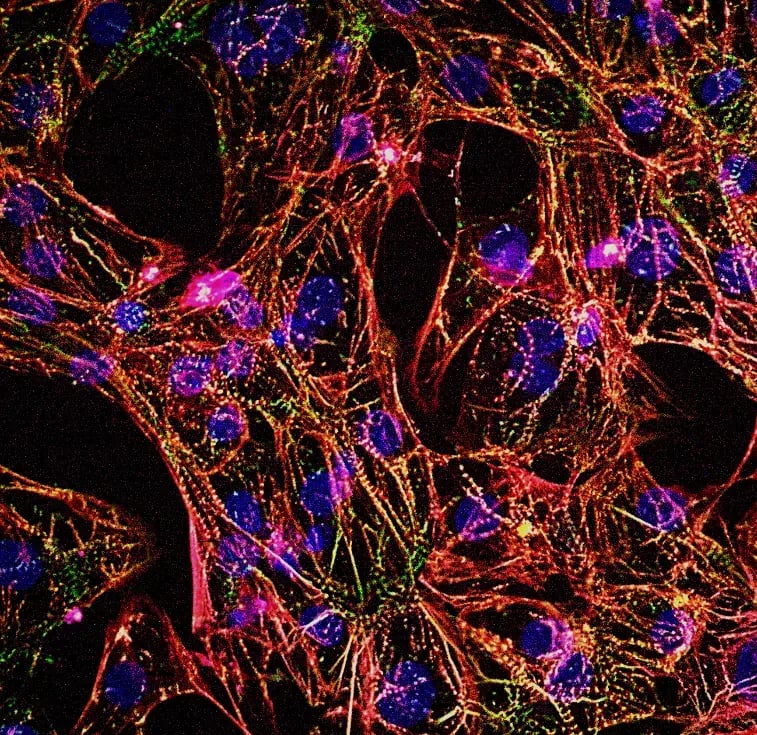
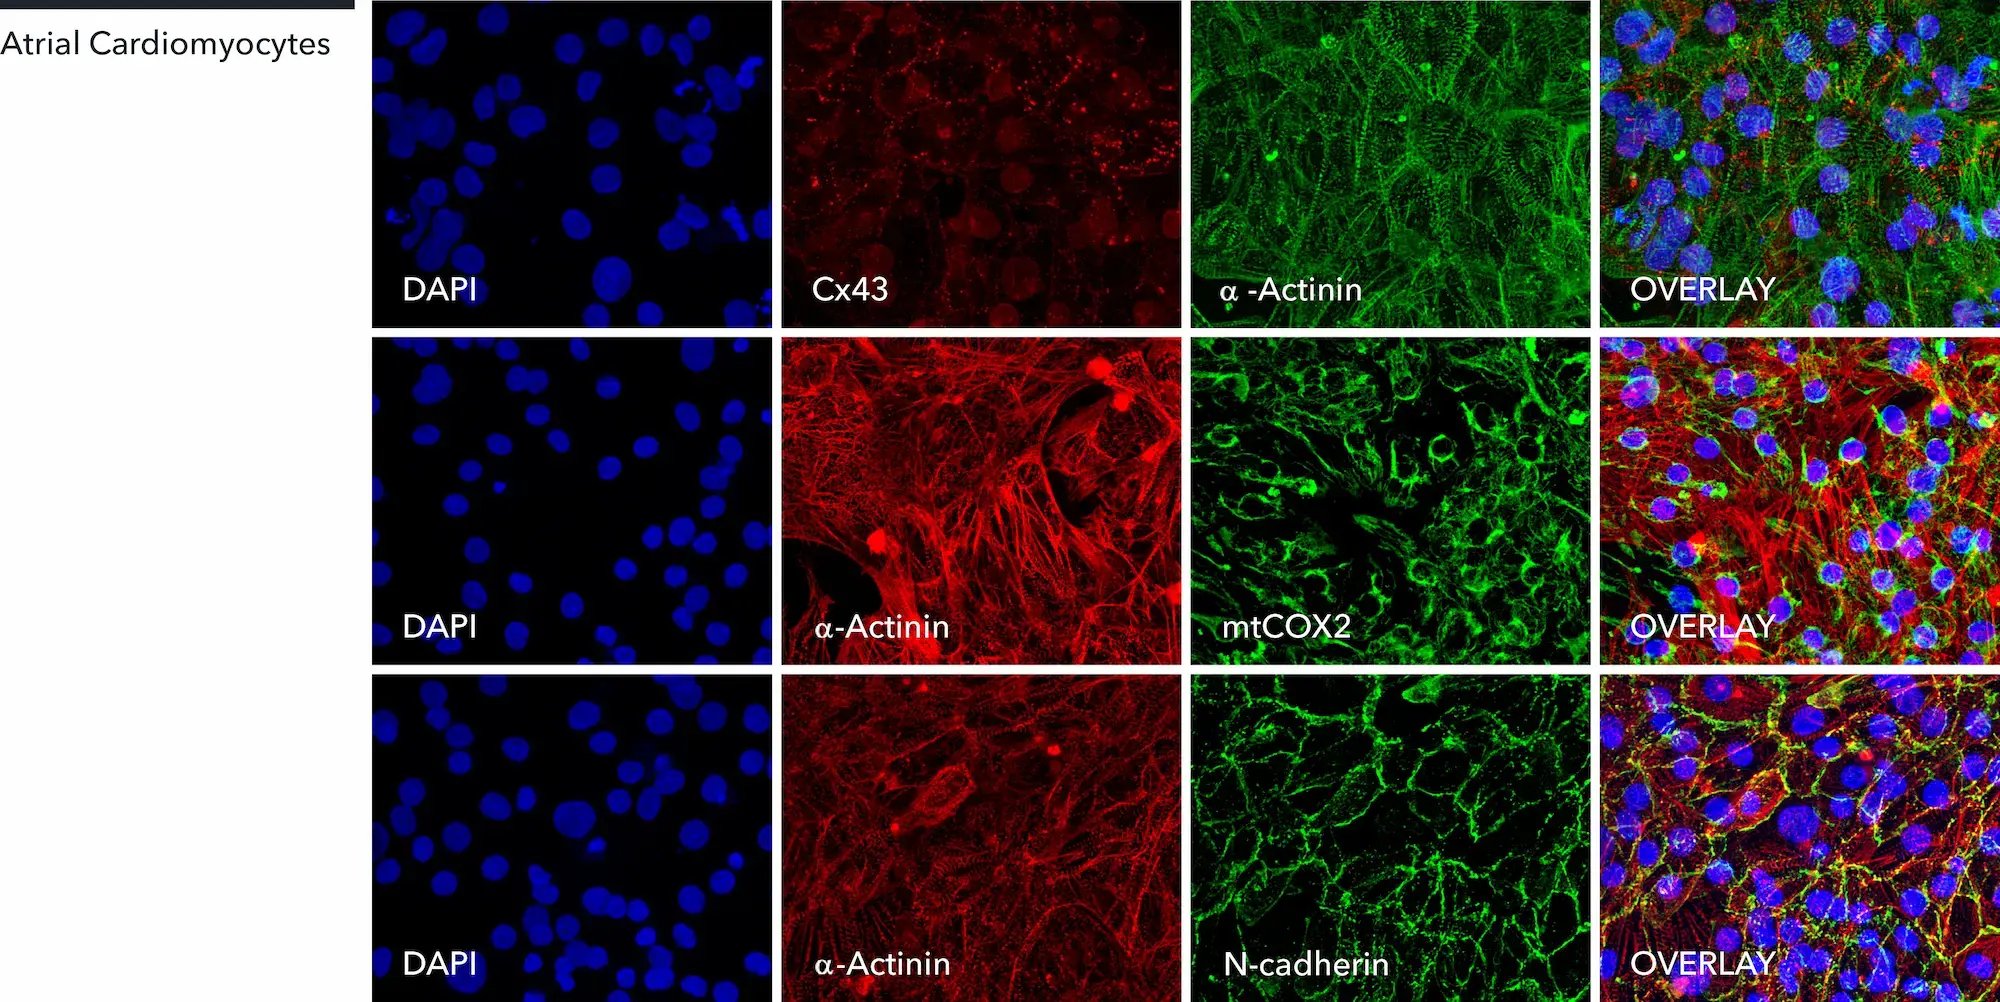
Immunofluorescent staining of human iPSC-derived Atrial Cardiomyocytes at day 10 post-thawing showing the presence of key cardiac markers α-actinin, connexin 43 (Cx43), mitochondrial COX2 (mtCOX2) and N-cadherin; 60x magnification.
A maximum number of 20 vials applies. If you would like to order more than 20 vials, please contact us at orders@bit.bio.

myrCell Atrial Cardiomyocytes are human iPSC-derived cells generated using traditional differentiation protocols. Delivered cryopreserved, they recover to exhibit a robust atrial phenotype. They express both pan-cardiac (cTnT, α-actinin) and chamber-specific markers (NPPA, MYH6, KCNA), which clearly distinguish them from ventricular cells.
Atrial Cardiomyocytes form electrically coupled monolayers and exhibit spontaneous, synchronised contractions within 7 days post-thaw. The cells display characteristic atrial electrophysiology, including shorter action potential duration and a distinct ion channel profile.
The cells are suitable for 2D functional assays, electrophysiology, calcium handling studies and pharmacological screening.
When paired with Ventricular Cardiomyocytes, they provide a genetically matched chamber-specific platform for comparative atrial and ventricular studies. These models facilitate target validation, cardiac safety pharmacology and cardiovascular drug discovery for atrial fibrillation research.
Atrial-specific
Exhibit a robust atrial phenotype with 99% MLC2a expression, clearly distinguishable from ventricular cells.
Functional
Spontaneously active with atrial-characteristic electrophysiology and contractile properties, suitable for functional assays and screening.
Quick
Ready to use for functional experiments within 7 days post-revival.
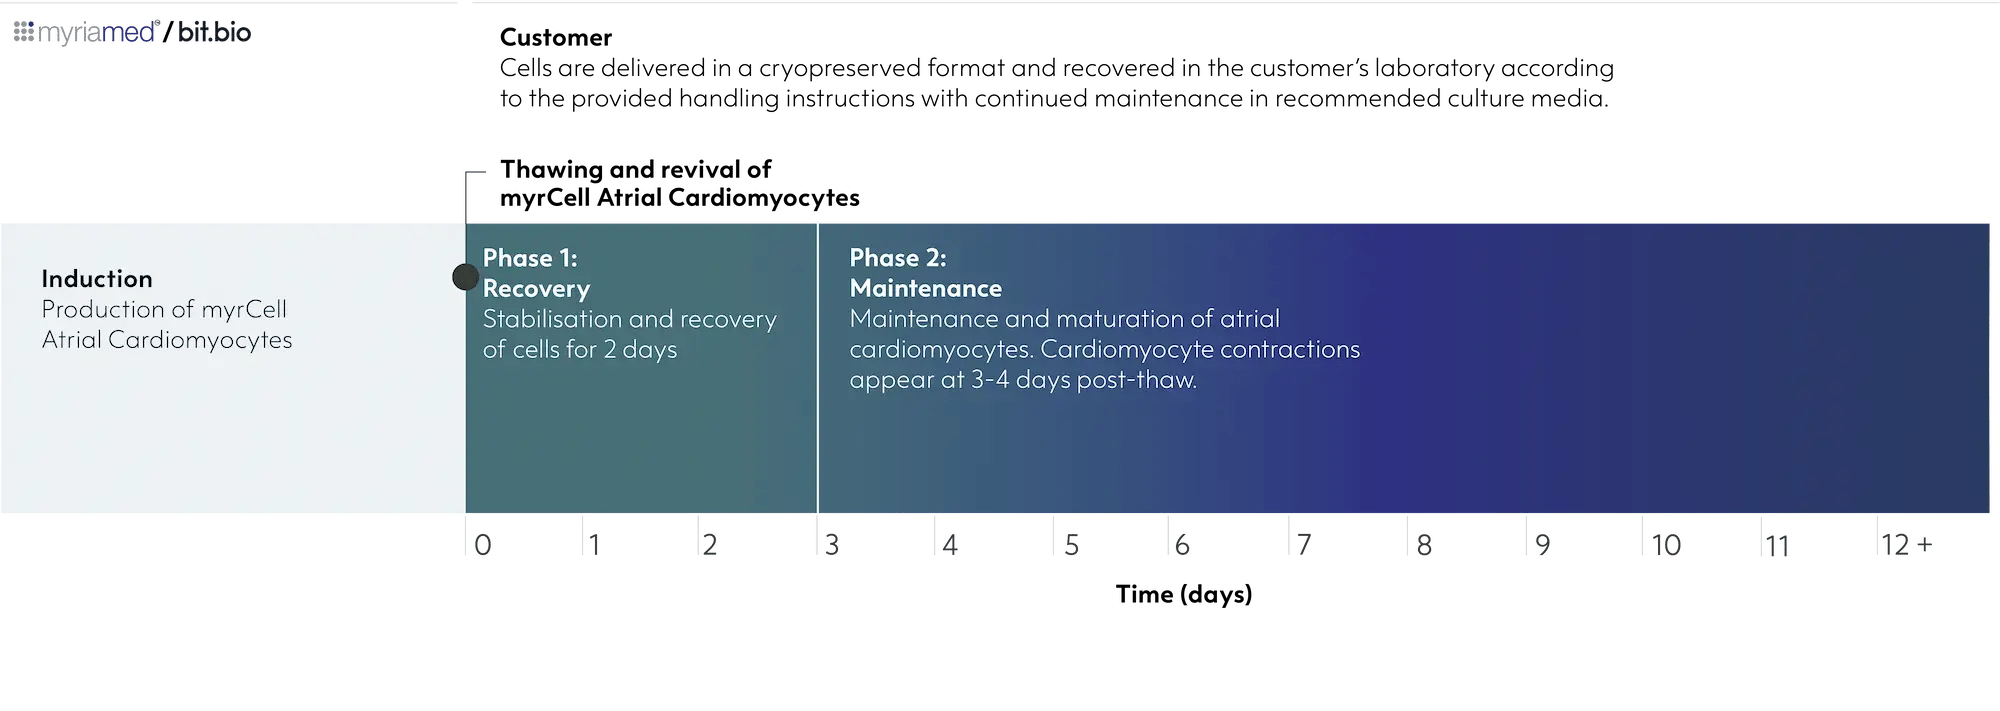
Atrial Cardiomyocytes are delivered in a cryopreserved format and recovered in the customer’s laboratory according to the provided handling instructions with continued maintenance in recommended culture media.
Starting material
Human iPSC line, W001
Karyotype
Normal (46, XY)
Seeding compatibility
6, 12, 24, 48 & 96 well plates
Shipping info
Dry ice
Donor
Male
Vial size
Small: >1 x 10⁶ viable cells
Quality control
Sterility, protein expression (ICC)
Differentiation method
Small molecule-directed differentiation
Recommended minimum seeding density
150,000 cells/cm²
User storage
LN2 or -150°C
Format
Cryopreserved cells
Product use
myrCells are for research use only
Applications
Cardiovascular research
Atrial fibrillation research
Disease modelling
2D screening and functional assays
3D engineered heart muscle
Enabling scientists to use human cells in their research, running additional experiments without rationing cells or limiting experimental scale
| Order quantity | Total vials received | Pricing tier |
| 1 - 9 packs | 3 - 27 vials | Standard price |
| 10 - 33 packs | 30 - 99 vials | Automatic 10% discount |
| > 34 packs | > 100 vials | > Contact us for a quote |
Atrial Cardiomyocytes form confluent, electrically coupled monolayers within 7 days
Brightfield images showing the attachment of Atrial Cardiomyocytes cultured on Matrigel-coated flasks. Cells form confluent, electrically coupled monolayers and develop spontaneous, synchronised beating following thawing; images acquired at day 3 and day 20 post-thaw (10x objective).
Atrial Cardiomyocytes show spontaneous, synchronised beating
Video showing spontaneous beating of Atrial Cardiomyocytes cultured in Matrigel-coated flasks; representative of day 20 post-thaw; 10x magnification.
Atrial Cardiomyocytes express key cardiac specific markers
Immunofluorescent staining of human iPSC-derived Atrial Cardiomyocytes at day 10 post-thawing showing the presence of key cardiac and atrial-associated markers α-actinin, cardiac troponin T (cTNT), cardiac troponin I (cTnI) and Myosin regulatory light chain 2, atrial isoform (MLC2a). The staining demonstrates organised sarcomeric α-actinin and cardiac marker expression, together with MLC2a expression consistent with atrial cardiomyocyte identity; 60x magnification.
Immunofluorescent staining of human iPSC-derived Atrial Cardiomyocytes at day 10 post-thawing showing the presence of key cardiac markers α-actinin, connexin 43 (Cx43), mitochondrial COX2 (mtCOX2) and N-cadherin; 60x magnification.
Atrial Cardiomyocytes exhibit a distinct atrial phenotype at day 10 post-thaw
Flow cytometry analysis at day 10 post-thaw confirms purity and atrial phenotype. The population demonstrates high expression of the atrial marker MLC2A and low expression of the ventricular marker MLC2V, verifying a predominantly atrial phenotype. Isotype controls were used for gating.
RNA sequencing confirms distinct ventricular and atrial phenotypes
RNA sequencing (RNA-seq) demonstrates robust chamber-specific differentiation of Ventricular and Atrial Cardiomyocytes (CM). Differential gene expression and hierarchical clustering reveal distinct ventricular and atrial transcriptomic signatures, confirming reproducible lineage specification and molecular identity across independent differentiation batches. The cells were harvested for RNA-seq at day 7 post-thaw.
Volcano plot showing differential gene expression (A). The x-axis represents log2 fold change (FC) and the y-axis shows -log10 (p value) for each gene. Genes with significant upregulation (blue) or downregulation (red) are labeled, with prominent cardiac-related genes.
Heatmap depicting the relative expression (row Z-score) of selected cardiac-related genes across samples; gene names are listed on the right (B). The heatmap reveals distinct clustering patterns between conditions. The colour scale ranges from -3 (red, indicating lower expression) to +3 (blue, indicating higher expression).
Data were generated from three wild-type iPSC lines (W001, W003, W005) differentiated into both ventricular and atrial cardiomyocytes across 3–4 independent batches. For each line and batch, three technical replicates were pooled prior to sequencing. Ventricular Cardiomyocytes, cat. no. 02-1001-0000, and Atrial Cardiomyocytes, cat. no. 06-1001-0000, are generated from iPSC line W001. Please enquire for further information about iPSC lines W003 and W005.
Robust functional expression of key cardiac ion channels confirmed by automated patch-clamp analysis
Automated patch-clamp analysis confirms robust expression of key cardiac ion channels in Ventricular (red) and Atrial (blue) Cardiomyocytes (CM).
Representative INa current traces with mean ± SEM peak INa amplitude and I-V curve (A).
Representative ICa,L current traces with mean ± SEM peak ICa,L amplitude and I-V curve fitted with Boltzmann-Ohm curve (B).
Representative trace showing basal inward rectifier current (IK1) in the presence of 20 mM KCl (black) and BaCl2 (grey) and mean ± SEM IK1 at -100 mV (C).
Measurements were acquired from iPSC-derived cardiomyocytes cultured for 50 days post-thaw. Comparisons were made using unpaired Student’s t-test, Mann Whitney’s U-test vs. Ventricular. ****p<0.0001, *p<0.05; n/N = iPSC-CM/batches.
Mature electrophysiological phenotypes demonstrated by action potential recordings
Representative action potential (AP) recordings demonstrate mature ventricular and atrial phenotypes.
Representative membrane voltage (mV) traces showing atrial and ventricular triggered APs in Atrial (blue) and Ventricular (red) Cardiomyocytes (CM) (left).
AP duration at 90% (APD90) and 50% (APD50) repolarisation as mean ±SEM (centre and right).
Measurements were acquired from human iPSC-derived cardiomyocytes cultured for 7 days post-thaw. Comparisons were made using unpaired Student's t-test, Mann Whitney's U-test vs. Ventricular. ****p<0.0001; n = iPSC-CM from one batch.
Chamber-specific contractile properties confirmed by quantitation of contractile dynamics
Contraction analysis using CytoMotion label-free, image-based motion detection software (IonOptix), confirms chamber-specific contractile function of Ventricular (red) and Atrial (blue) Cardiomyocytes (CM).
Frequency (Hz), time to peak (sec), and time to 90% baseline (sec) showed as mean ± SEM (A).
Representative traces showing contraction of human iPSC-derived cardiomyocytes monolayers as mean ± SEM (B).
Measurements were acquired from iPSC-derived cardiomyocytes cultured for 50 days post-thaw. Comparisons were made using unpaired Student's t-test, Mann Whitney's U-test vs. Ventricular. ****p<0.001; n/N = measurement ROI/batches.
Atrial Cardiomyocytes express chamber-specific markers, including NPPA (ANP), MYH6, and KCNA5, and show a distinct, shorter action potential profile compared with the ventricular cells, which are defined by MLC2v and MYH7 expression.
Atrial Cardiomyocytes have been cultured in 2D monolayer for ~50 days post-thaw. During this period, the cells remain functionally active, as demonstrated by expected ion channel currents and action potential measurements.
Following recovery, Atrial Cardiomyocytes are expected to exhibit spontaneous contractions consistent with an atrial phenotype.
Wild-type Atrial Cardiomyocytes are suitable for chamber-selective and atrial-specific disease modelling.
Atrial Cardiomyocytes are compatible with atrial-specific electrophysiology, calcium transient analysis, atrial-selective pharmacology, transcriptomics, and disease modelling relevant to atrial fibrillation and atrial-specific cardiovascular research.
Consistent. Defined. Scalable.