_MAP2(R)_DAPI(B)_%20(1).png?width=834&height=832&name=a.HTT50CAGWT_Overlay__TUBB3(G)_MAP2(R)_DAPI(B)_%20(1).png)


%20is%20expressed%20in%20ioGlutamatergic%20Neurons%20HTT50CAG_WT%20-min.png?width=3429&height=1381&name=Disease-related%20Huntingtin%20(HTT)%20is%20expressed%20in%20ioGlutamatergic%20Neurons%20HTT50CAG_WT%20-min.png)


cat no | ioEA1004
ioGlutamatergic Neurons HTT 50CAG/WT
Human iPSC‑derived Huntington’s disease model
-
Cryopreserved human iPSC-derived cells powered by opti-ox that are ready for experiments in days
-
Engineered with a 50 CAG repeat in HTT for Huntington's disease research and drug discovery
-
Disease-related phenotype demonstrated by reduced network activity and mitochondrial dysfunction
Human iPSC‑derived Huntington’s disease model
ioGlutamatergic Neurons Media Kit
Cell culture media kit for the culture of ioGlutamatergic Neurons up to 14 days post-thaw
Significant mitochondrial dysfunction in Huntington’s disease model cells observed at day 25
Huntington’s disease (HD) is caused by an autosomal dominant expansion of a trinucleotide CAG repeat in the HTT gene. The mutant, aggregation-prone huntingtin protein has been reported to affect various cellular processes, including the biogenesis, fission, transport and respiration of mitochondria.
To investigate mitochondrial function, ioGlutamatergic Neurons HTT 50CAG/WT (mutHTT, pink) and the genetically matched wild-type control, ioGlutamatergic Neurons (WT, blue), were cultured and analysed using the Seahorse XF Cell Mito Stress Test Kit (A).
Culturing cells in BrainPhys, a physiologically relevant medium, supported mitochondrial respiration and unmasked a dramatic and significant mitochondrial dysfunction in the HD model cells at day 25 (B).
When cultured in neurobasal medium, wild-type and HD ioGlutamatergic Neurons switched from mitochondrial respiration to glycolysis over time, analysed by the Seahorse XF Cell Glycolysis Stress Test Kit. BrainPhys medium has been demonstrated to support mitochondrial respiration. Accordingly, we showed that using BrainPhys prevented the glutamatergic neurons switching to glycolysis during maturation. See the experimental details in our poster presented at Neuroscience 2024.
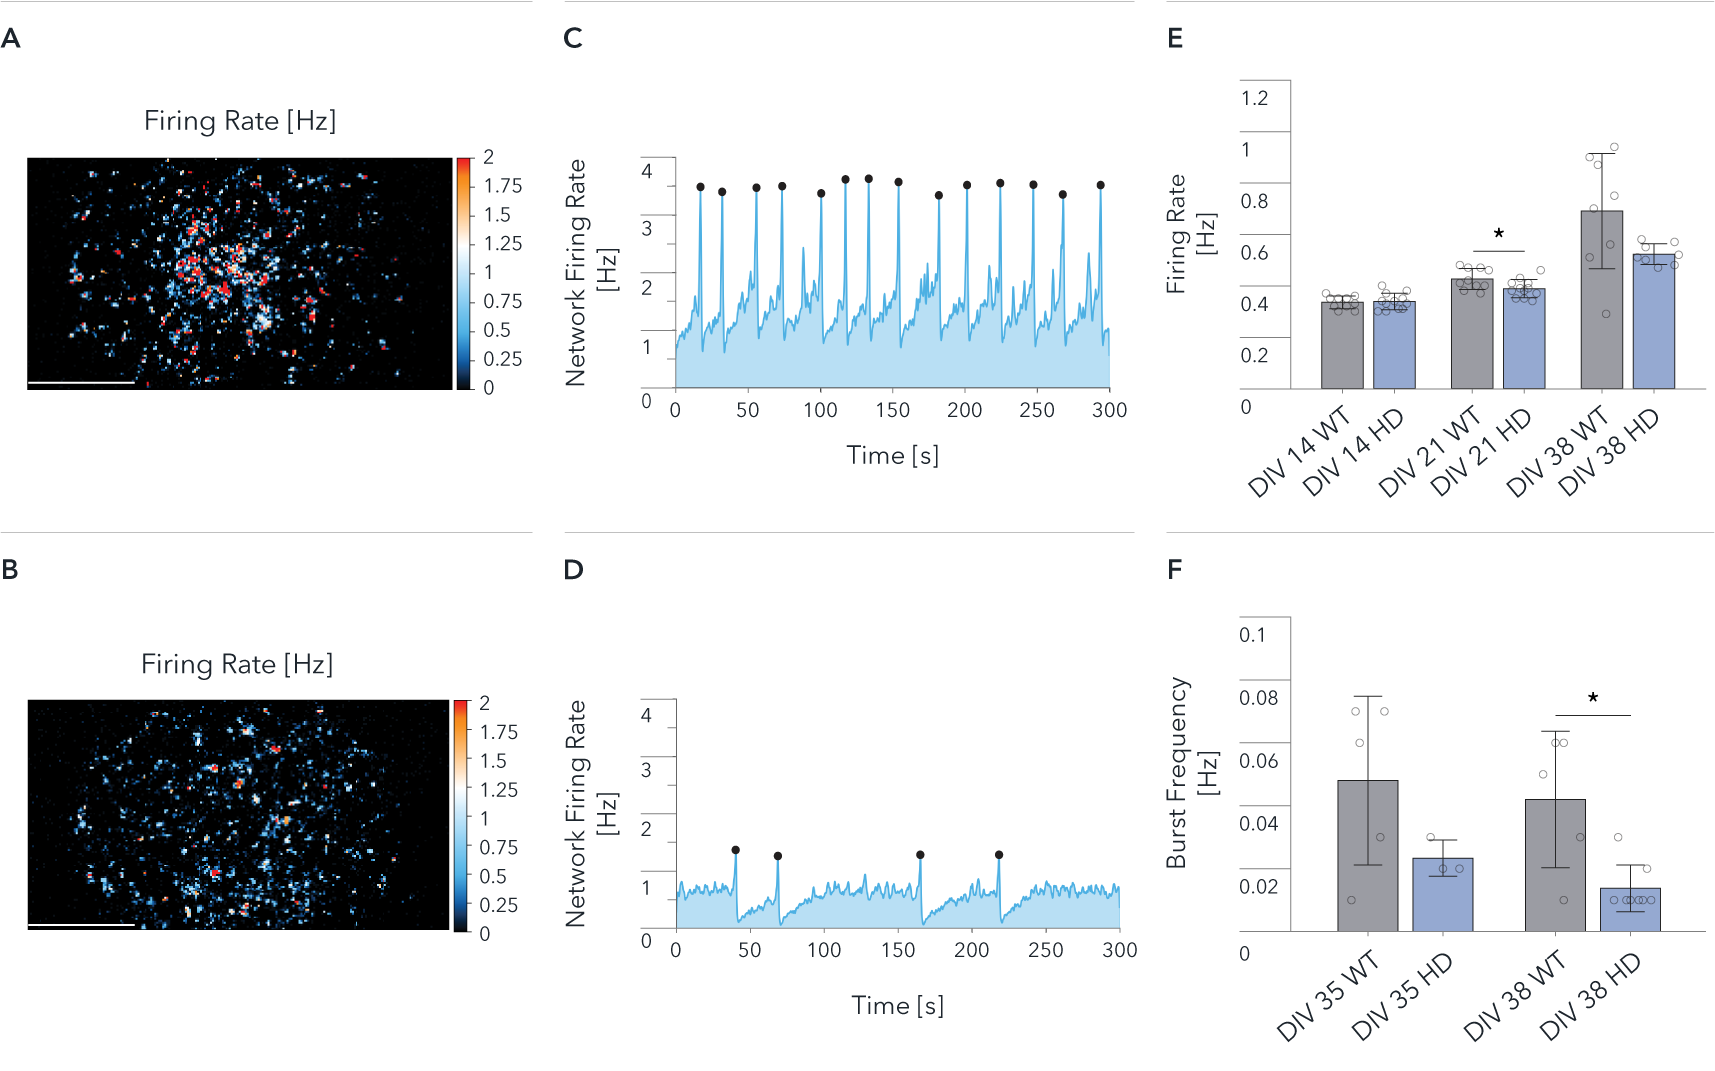
ioGlutamatergic Neurons HTT 50CAG/WT demonstrate a significant decrease in network activity compared to wild-type control by MEA analysis
Functional characterisation of ioGlutamatergic Neurons HTT 50CAG/WT by Charles River Laboratories using MaxWell’s MaxTwo high-density microelectrode array (HD-MEA) system. Comparison of wild-type ioGlutamatergic Neurons (WT) and Huntington’s disease model (HD) in single-cell and network development. Cells were cultured with hiPSC-derived astrocytes, and the culture medium was switched to BrainPhys from DIV6. The Activity Scan captures spontaneous action potentials of cells and reveals the spatial distribution of the electrical activity from the cell cultures over the electrode array.
-
Map of the Firing Rate distribution over 26,400 electrodes at DIV 38 for (A) WT and (B) HD.
-
Network Firing Rate at DIV 38, recorded for 300 sec. for (C) WT, and (D) HD.
-
(E) Mean Firing Rate recorded from 26,400 electrodes on each well. Data shows results from WT and HD at DIV 14, 21, 38.
-
(F) Mean Burst Frequency recorded from 26,400 electrodes on each well. Data shows results from WT and HD at DIV 35 and 38. Scale bar: 1mm, *p<0.05 (Mann Whitney U Test).
The wild-type cells show a higher spontaneous activity than the disease model cells (A, B, E); both cultures show synchronous and spontaneous network activity (C, D, F). The data demonstrate significant HD relevant differences at the network levels between wild-type and disease-model cells.
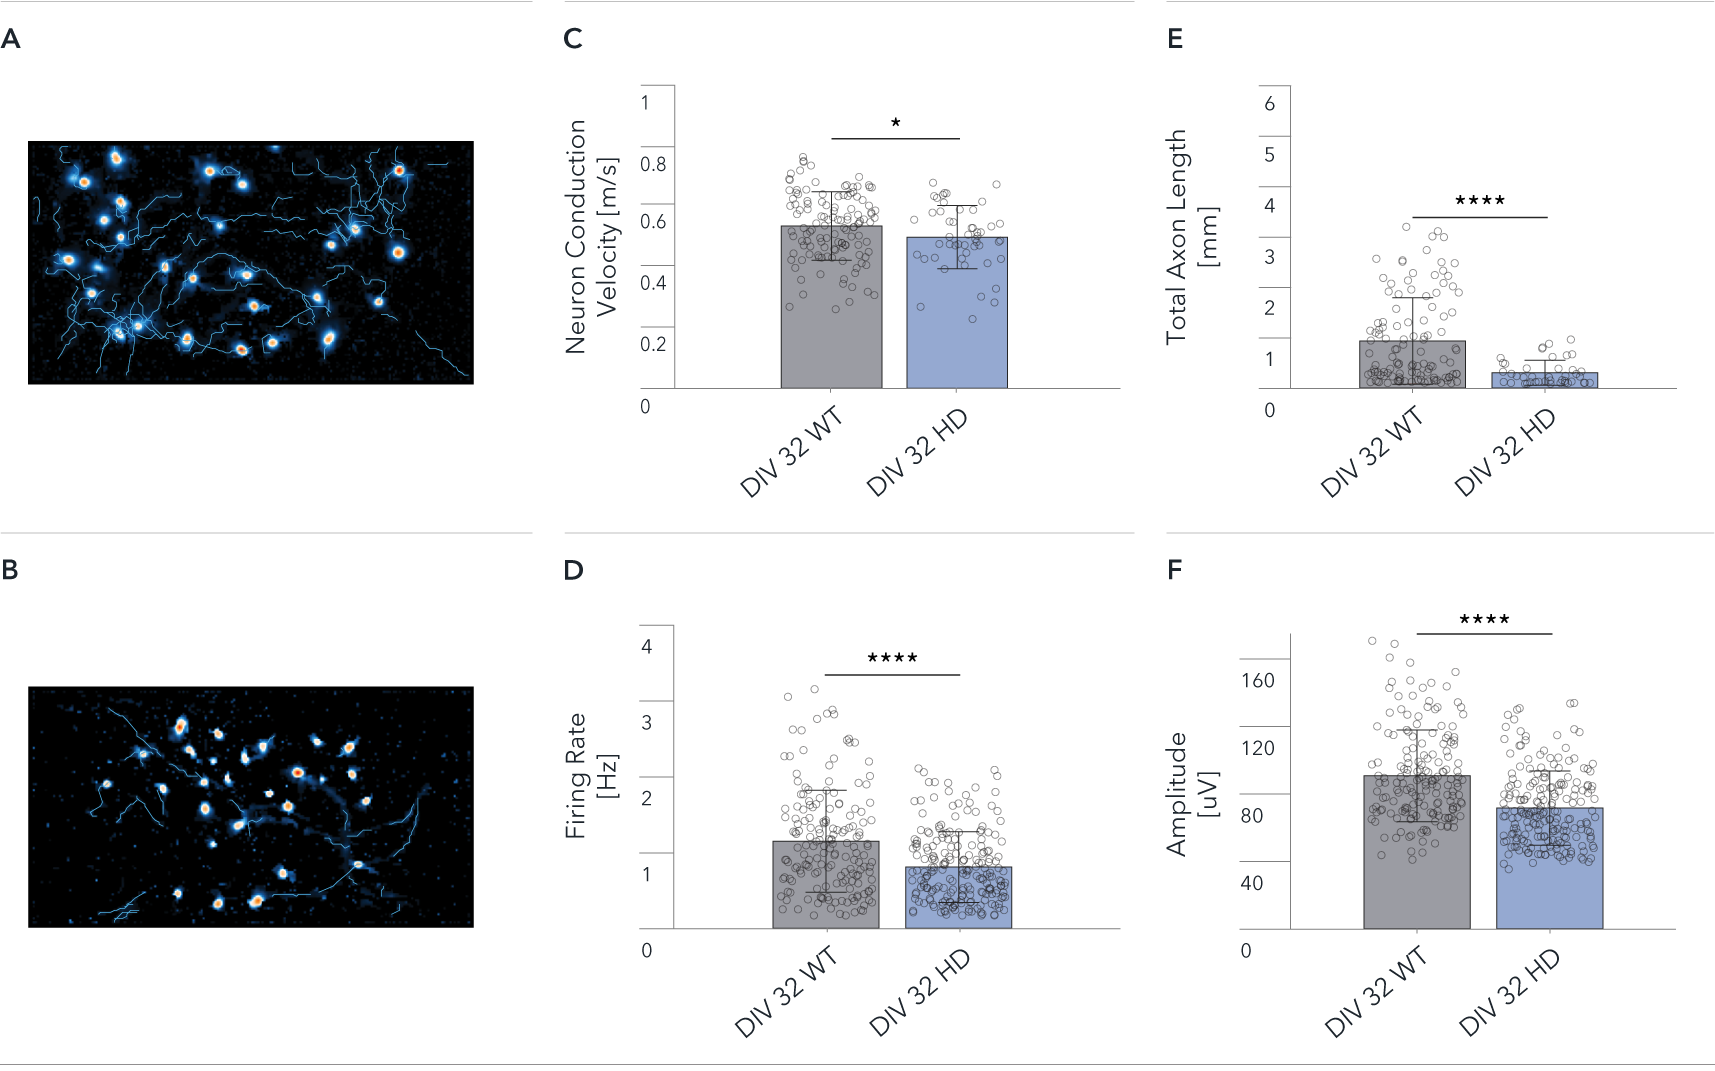
Single-cell analysis showing significant Huntington’s disease related differences between ioGlutamatergic Neurons HTT 50CAG/WT and wild-type control
Functional characterisation of ioGlutamatergic Neurons HTT 50CAG/WT by Charles River using HD-MEA. Single-cell analysis showing differences between ioGlutamatergic Neurons (WT) and ioGlutamatergic Neurons HTT 50CAG/WT (HD). The Axon Tracking assay reveals the spatial propagation of the neuronal action potential from the soma to distant axonal branches.
-
Map showing spatial distribution of the action potential amplitude for selected tracked neurons at DIV 32 for (A) WT, and (B) HD.
-
(C-F) Mean Neuron Conduction Velocity, Total Axon Length, Firing Rate, and Amplitude recorded from 26,400 electrodes on each well. Data shows results from WT and HD at DIV 32. Scale bar: 1mm, *p=0.05, ****p<0.0001 (Mann Whitney U Test).
The data demonstrate significant HD relevant differences at single-cell level between wild-type and disease-model cells.
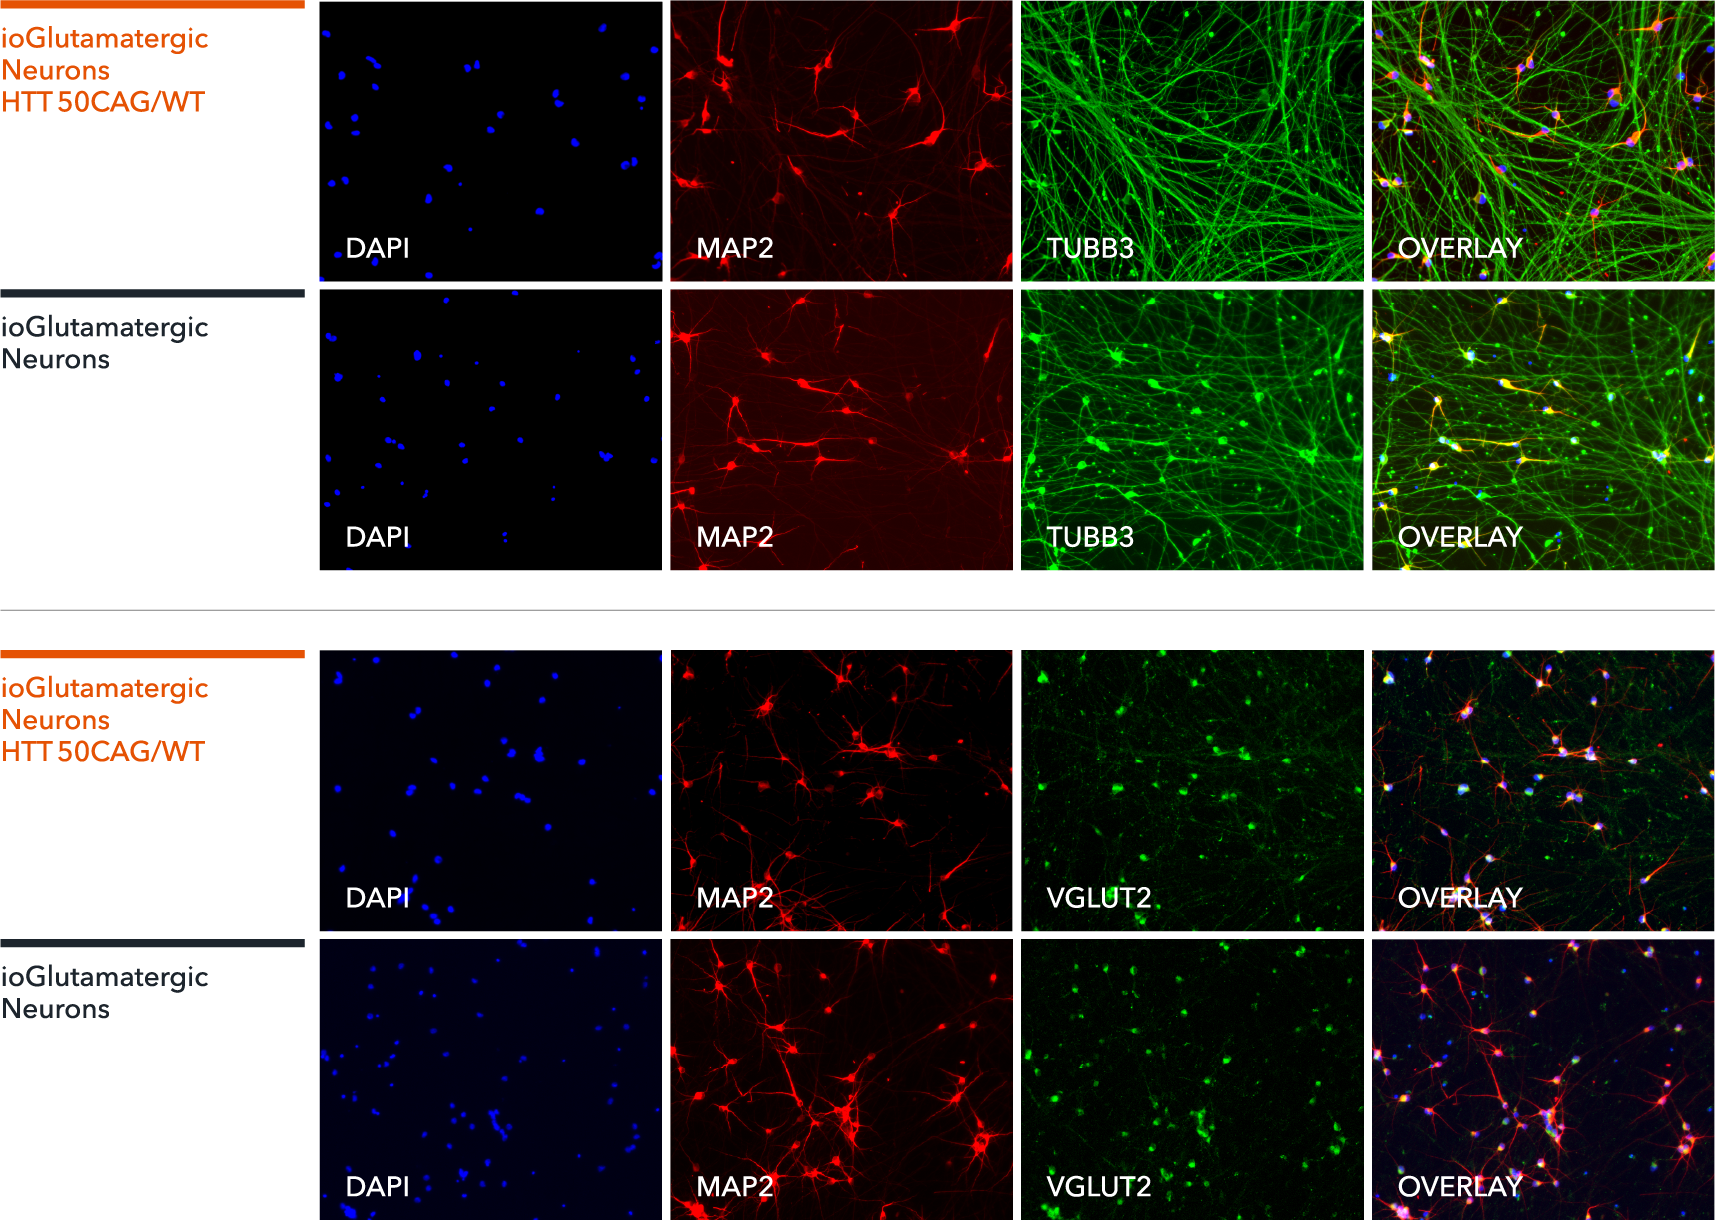
ioGlutamatergic Neurons HTT 50CAG/WT express neuron-specific markers comparably to the wild-type control
Immunofluorescent staining on day 11 post revival demonstrates similar homogenous expression of pan-neuronal proteins MAP2 and TUBB3 (upper panel) and glutamatergic neuron-specific transporter VGLUT2 (lower panel) in ioGlutamatergic Neurons HTT 50CAG/WT compared to the genetically matched control. 100X magnification.
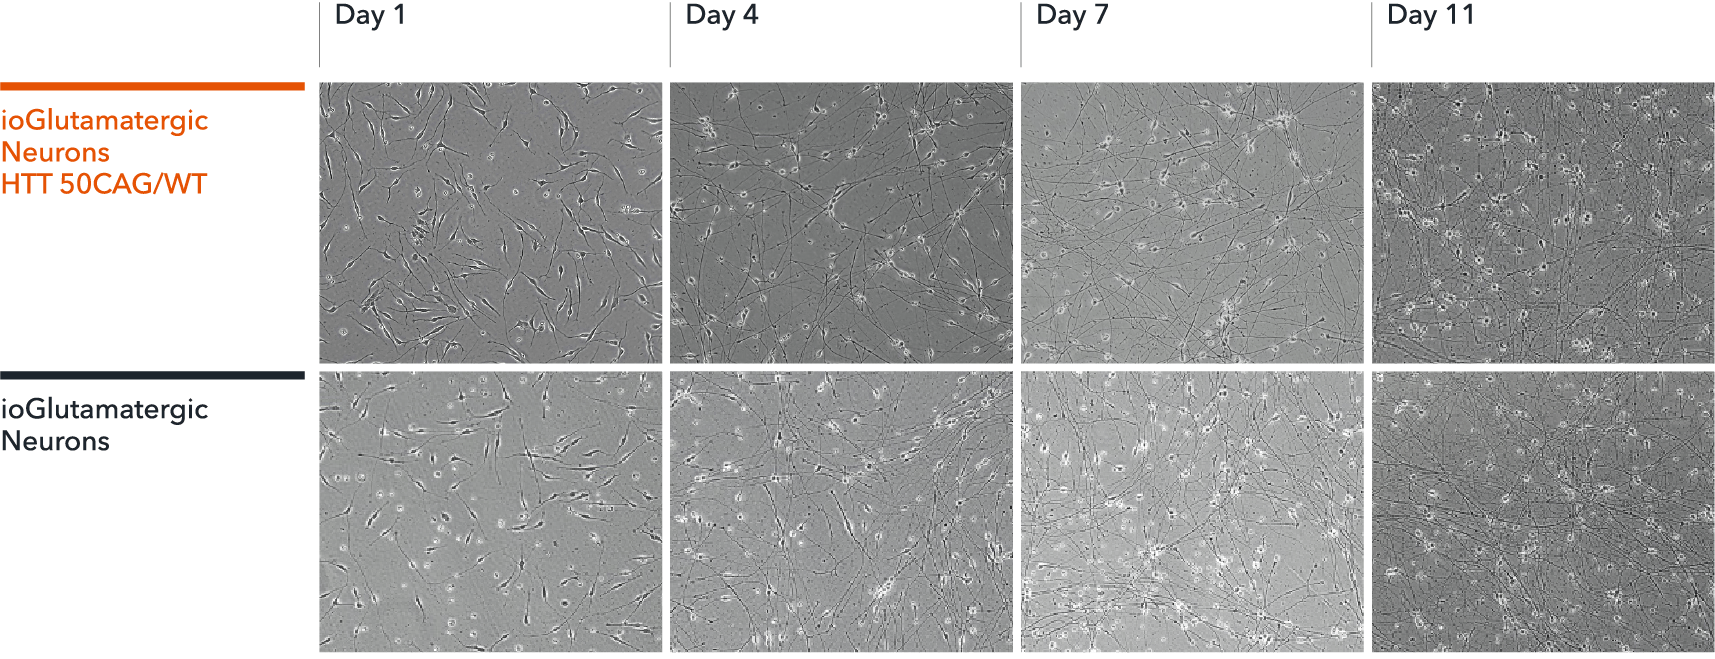
ioGlutamatergic Neurons HTT 50CAG/WT form structural neuronal networks by day 11
ioGlutamatergic Neurons HTT 50CAG/WT mature rapidly, show glutamatergic neuron morphology and form structural neuronal networks over 11 days, when compared to the genetically matched control. Day 1 to 11 post thawing; 100X magnification.
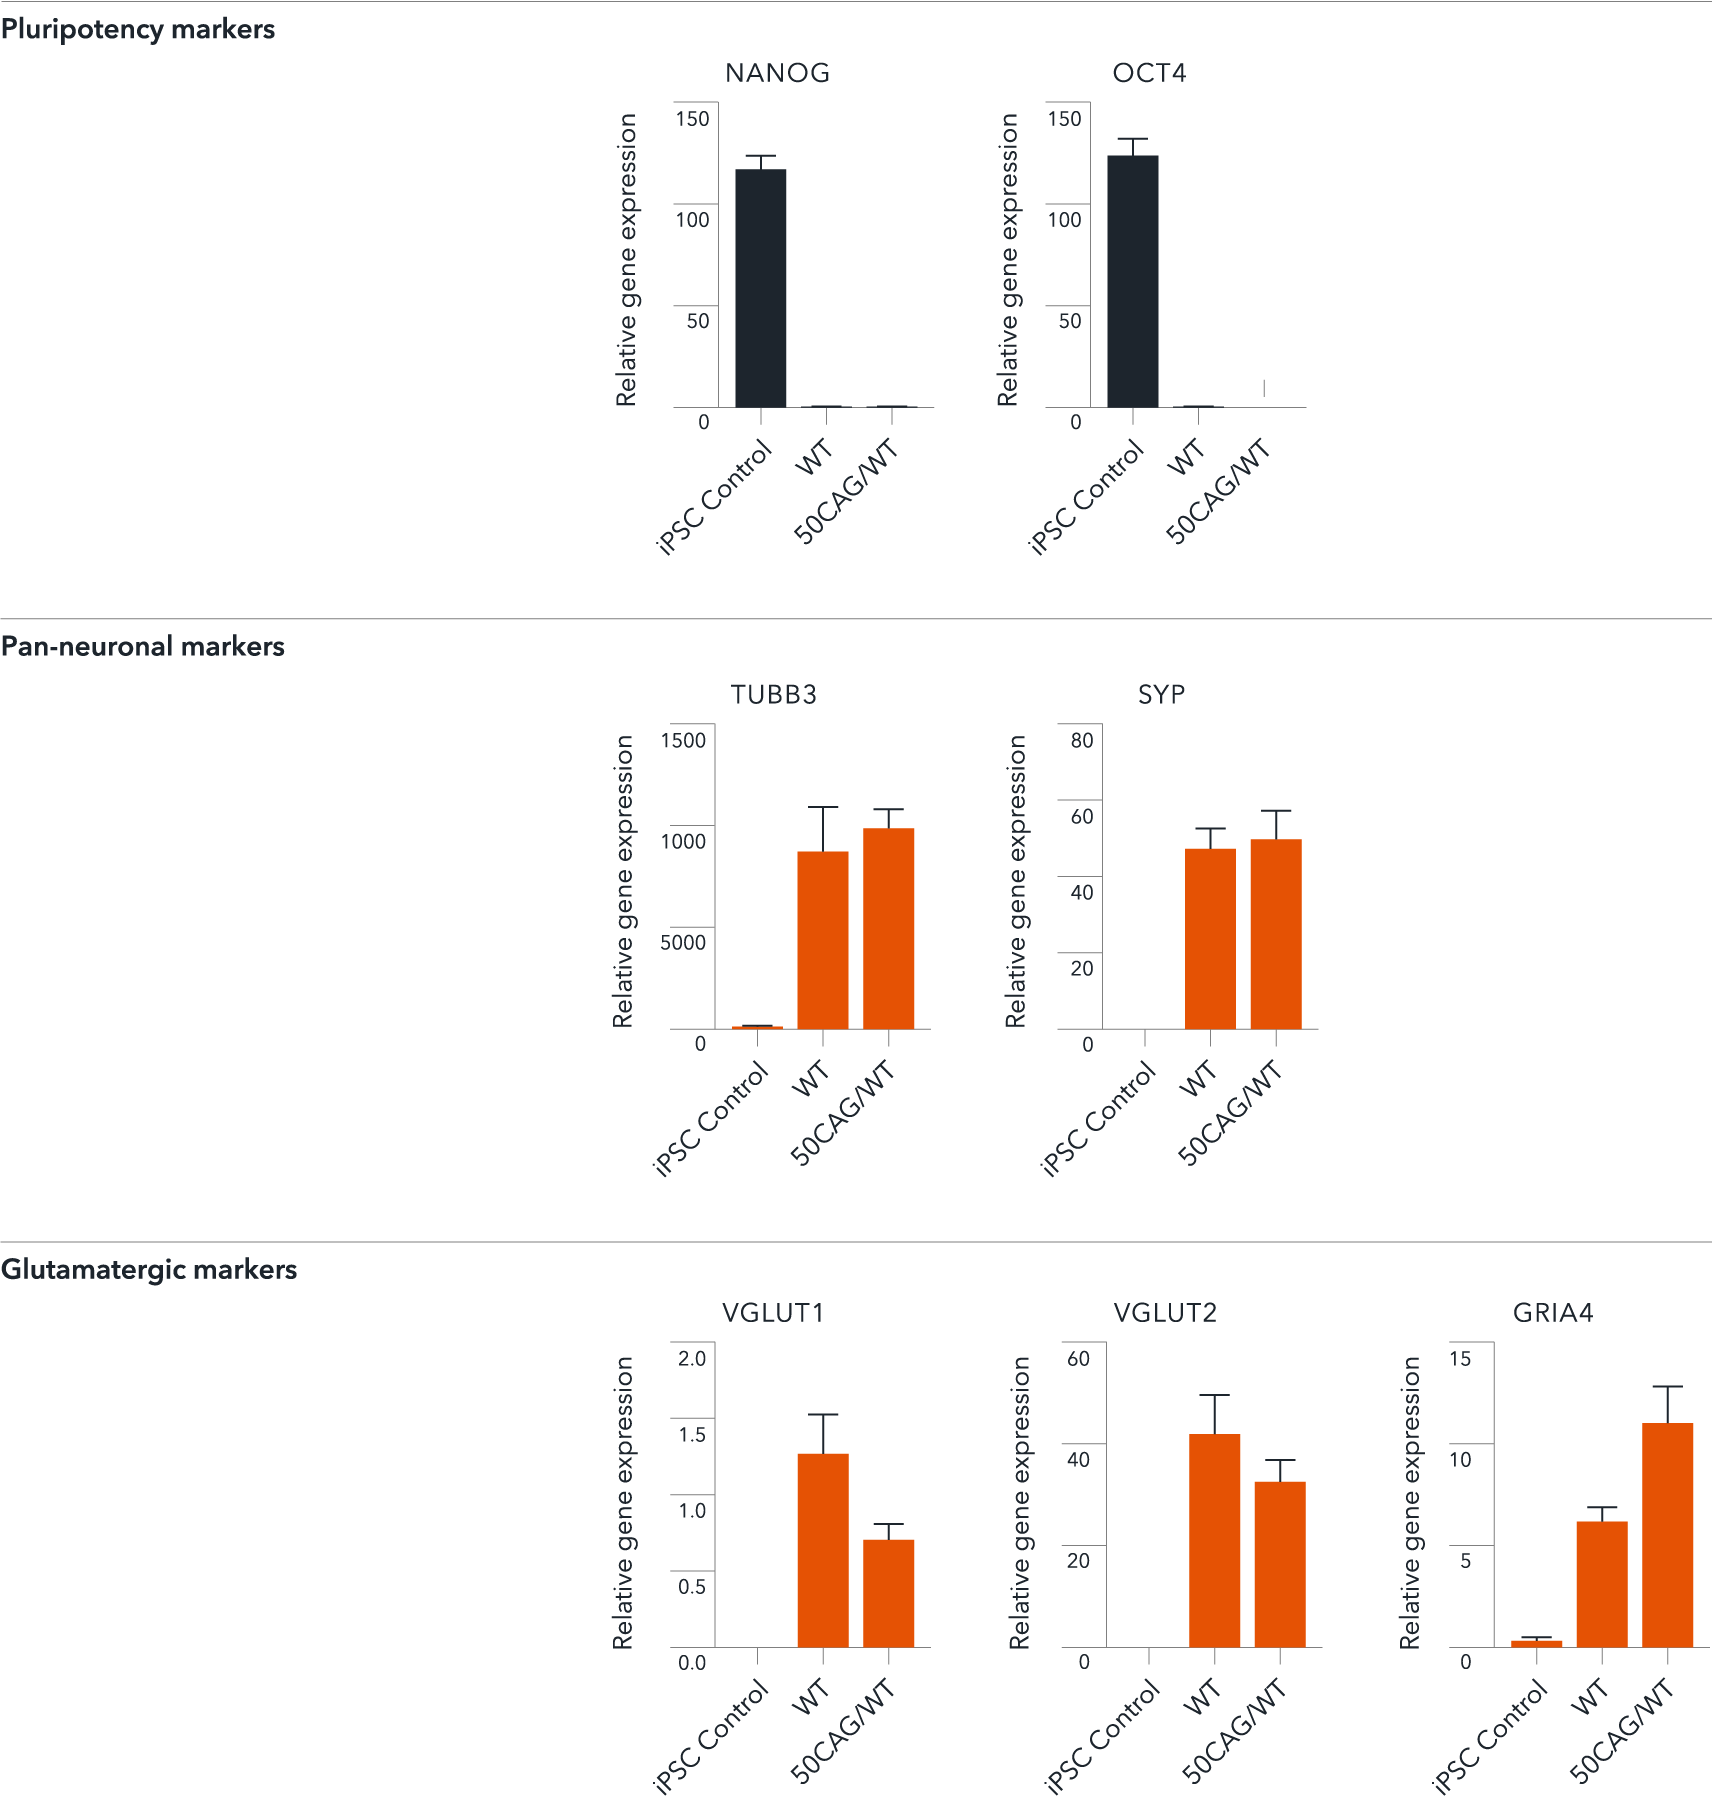
ioGlutamatergic Neurons HTT 50CAG/WT demonstrate gene expression of neuronal-specific and glutamatergic-specific markers following deterministic programming
Gene expression analysis demonstrates that ioGlutamatergic Neurons HTT 50CAG/WT (50CAG/WT) and the genetically matched wild-type control (WT) lack the expression of pluripotency markers (NANOG and OCT4) at day 11, while robustly expressing pan-neuronal (TUBB3 and SYP) and glutamatergic specific (VGLUT1 and VGLUT2) markers, as well as the glutamate receptor GRIA4. Gene expression levels were assessed by RT-qPCR (data normalised to HMBS; cDNA samples of the parental human iPSC line (hiPSC Control) were included as reference). Data represents day 11 post-revival samples, n=2 replicates.
View the step-by-step RNA extraction and RT-qPCR protocol used to generate this data
Disease-related Huntingtin (HTT) is expressed in ioGlutamatergic Neurons HTT 50CAG/WT
RT-qPCR analysis demonstrates similar expression level of the Huntingtin gene in both wild-type ioGlutamatergic Neurons (WT) and ioGlutamatergic Neurons HTT 50CAG/WT (50CAG/WT) at day 11 post-revival (n=2 replicates). cDNA samples of the parental human iPSC line (hiPSC Control) were included as reference.
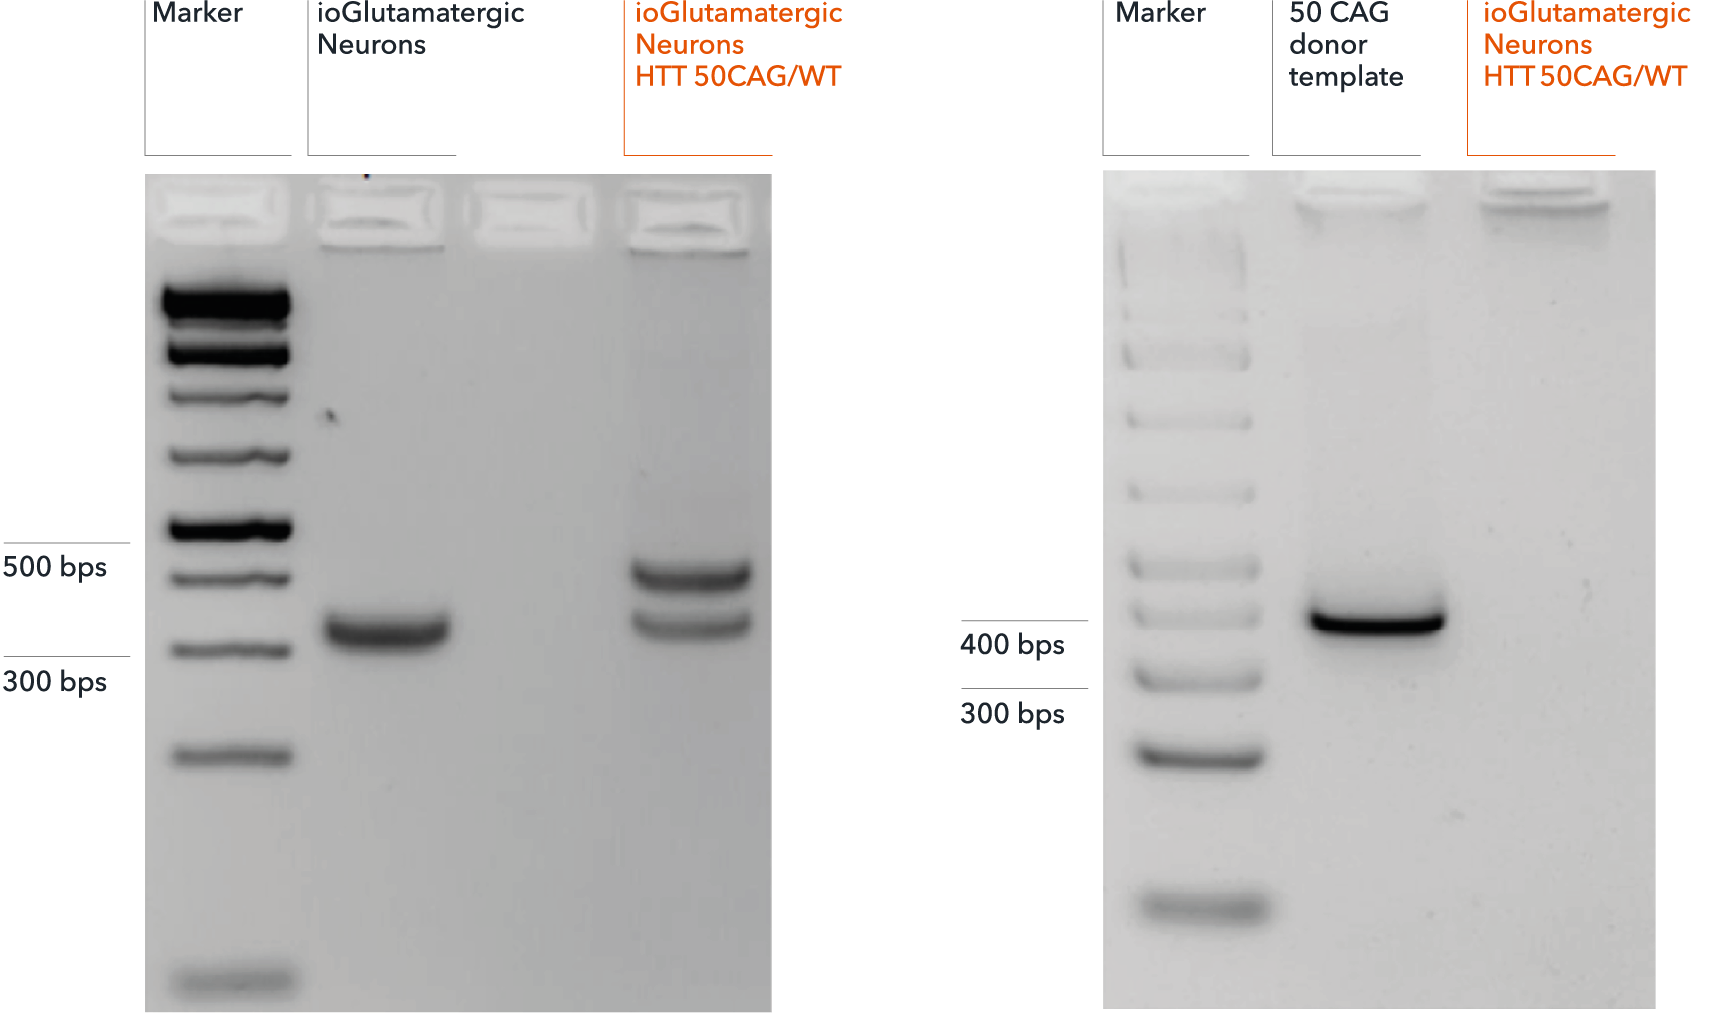
Genotype validation of heterozygous 50 CAG repeat expansion
(A) Successful on-target integration into one HTT allele confirmed by gel electrophoresis. Genotyping primers flanking the endogenous HTT CAG repeat expansion region produce a band at approximately 320 bps, by PCR, in both genetically matched control (ioGlutamatergic Neurons) and disease model (ioGlutamatergic Neurons HTT 50CAG/WT). PCR fragments at 395 bps detect on-target gene editing and introduction of a 50 CAG repeat expansion in ioGlutamatergic Neurons HTT 50CAG/WT only. (B) Amplicon PCR of the plasmid donor reveals no random integration in genomic DNA from targeted colonies via gel electrophoresis. Off-target random insertion of the donor template (used to introduce the 50 CAG repeat expansion at the WT HTT locus) is detected by PCR amplification of the donor vector backbone. This is not detected in the samples from ioGlutamatergic Neurons HTT 50CAG/WT.
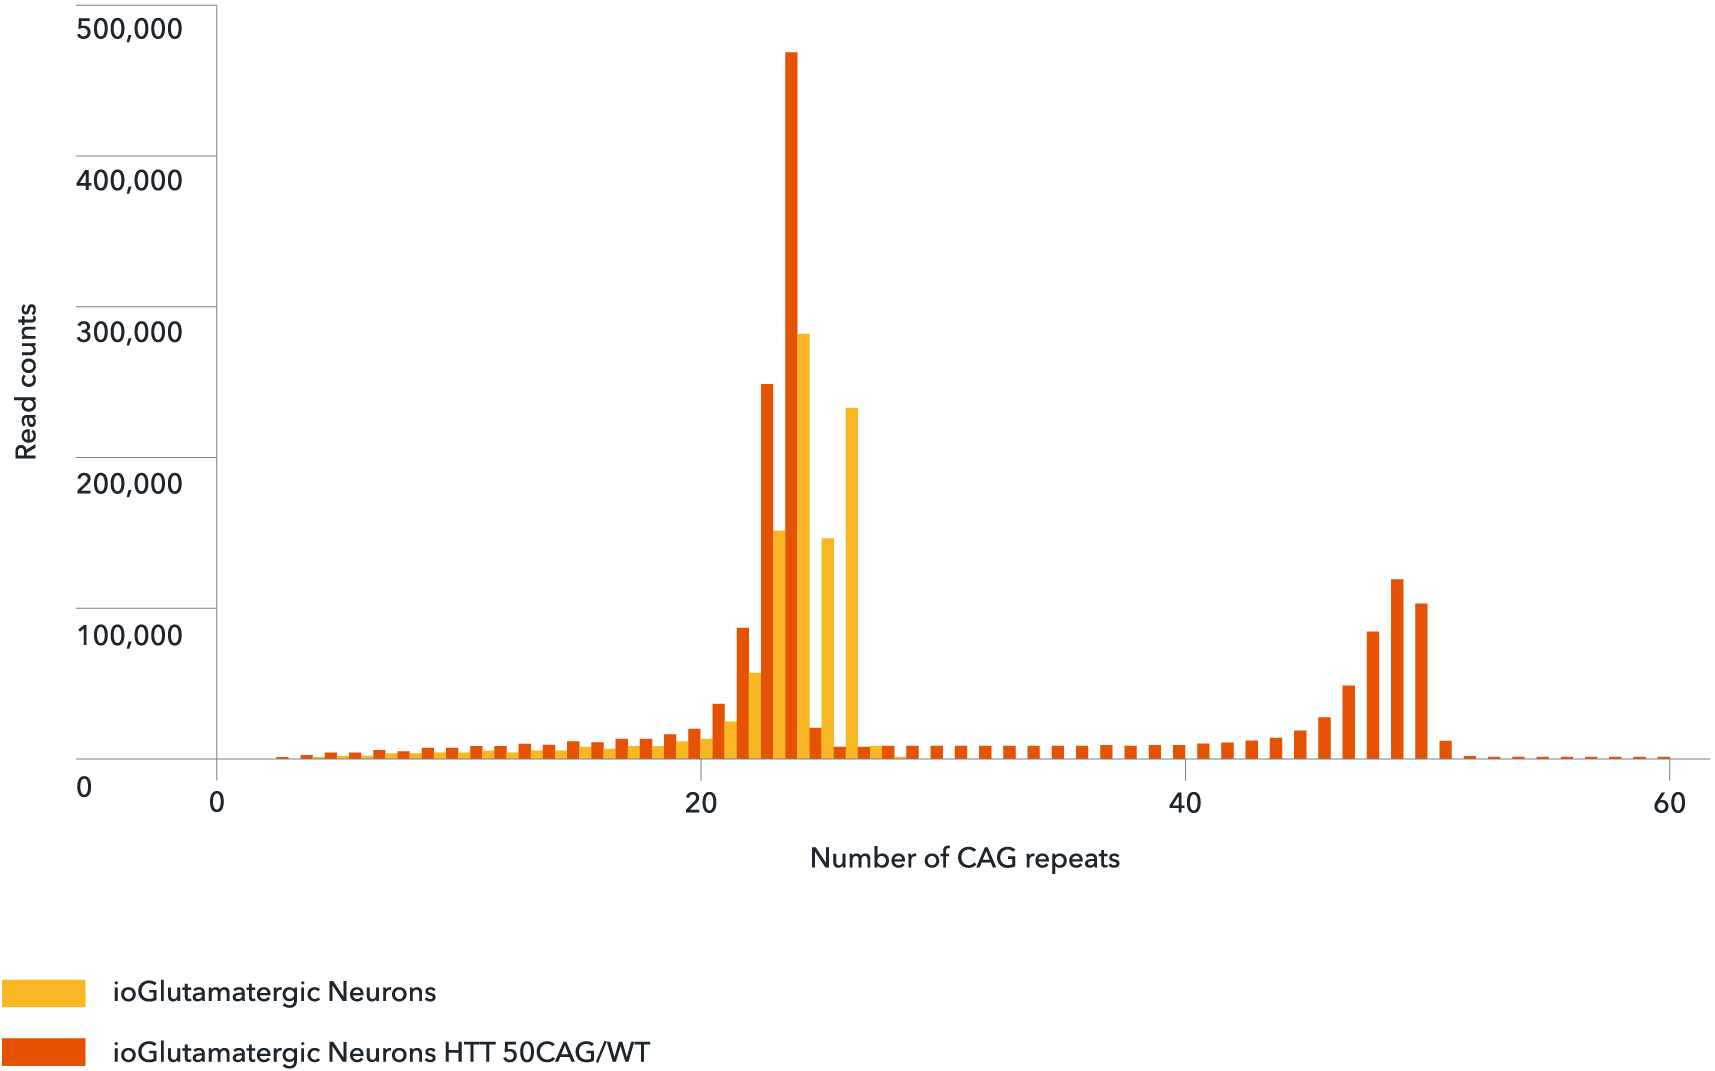
Genotype validation of the number of CAG repeats
NGS-amplicon sequencing confirms the number of CAG repeats in wild-type ioGlutamatergic Neurons (yellow) and ioGlutamatergic Neurons HTT 50CAG/WT (orange). The number of CAG repeats shows a peak at the normal physiological range of 24 for both the wild-type and disease model cells. The 50 CAG repeat was detected only in the disease model cells (orange) confirming the successful introduction of a heterozygous 50 CAG repeat expansion in ioGlutamatergic Neurons HTT 50CAG/WT.
Phenotypic characterisation of a human iPSC-derived tri-culture using ioGlutamatergic Neurons, ioAstrocytes, and ioMicroglia
Using our fully optimised protocol, ioGlutamatergic Neurons (MAP2, red), ioMicroglia (IBA1, yellow) and ioAstrocytes (vimentin, cyan) were co-cultured to create a highly defined CNS model. High-resolution ICC analysis confirms the successful co-localisation and morphological health of three distinct cell types within a unified environment. By day 7, the protocol yields a highly consistent, integrated network suitable for complex cell modelling. DAPI (blue) highlights the total cell density and integrity of the culture. This protocol is compatible with derivative products of the three cell types, ensuring straightforward implementation across experimental workflows.
Efficient mRNA transfection into ioGlutamatergic Neurons
ioGlutamatergic Neurons are efficiently transfected and show sustained long-term expression of mRNA encoding GFP. ioGlutamatergic Neurons were imaged from day 1 post-thaw and throughout the experiment to assess transfection efficiency and evaluate potential cytotoxic effects of the transfection protocol. Day 1 images were captured prior to transfection on the same day.
Download the step-by-step protocol for lipid-based delivery of synthetic mRNA into ioGlutamatergic Neurons.
Lipid-based delivery of synthetic mRNA into ioGlutamatergic Neurons
ioGlutamatergic Neurons were transfected 24 hours post-thaw using Lipofectamine™ Stem Transfection Reagent. The transfection efficiency was evaluated by fluorescence imaging over 18 days after mRNA delivery, resulting in high transfection efficiency (close to 100%) and long-term sustained GFP expression.
Quantification of the GFP signal shows a decrease in GFP intensity over time, while the percentage of GFP-positive cells remains largely unchanged over time.
(A) The percentage of GFP-positive cells from two independent experiments.
(B) GFP intensity, quantified in successfully transfected cells from two independent experiments is quantified and normalised to day 2 (24 hours post-transfection).
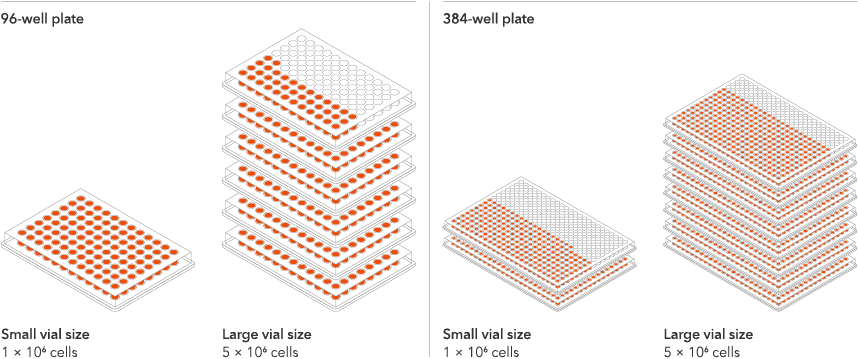
Industry leading seeding density
The recommended minimum seeding density is 30,000 cells/cm2, compared to up to 250,000 cells/cm2 for other similar products on the market. One small vial can plate a minimum of 0.7 x 24-well plate, 1 x 96-well plate, or 1.5 x 384-well plates. One large vial can plate a minimum of 3.6 x 24-well plates, 5.4 x 96-well plates, or 7.75 x 384-well plates. This means every vial goes further, enabling more experimental conditions and more repeats, resulting in more confidence in the data.
Vial limit exceeded
A maximum number of 20 vials applies. If you would like to order more than 20 vials, please contact us at orders@bit.bio.


%20is%20expressed%20in%20ioGlutamatergic%20Neurons%20HTT50CAG_WT%20-min.png?width=1712&height=689&name=Disease-related%20Huntingtin%20(HTT)%20is%20expressed%20in%20ioGlutamatergic%20Neurons%20HTT50CAG_WT%20-min.png)
_MAP2(R)_DAPI(B)_%20(1).png?width=604&name=a-HTT50CAGWT_Overlay__TUBB3(G)_MAP2(R)_DAPI(B)_%20(1).png)


.jpeg?width=604&name=New%20Project%20(6).jpeg)

_MAP2(R)_Tubb3(B)_Hoechst(B)_20x_merge-comp.jpg?width=604&name=Colour%20webinar%20with%20it-bio%20ioGlutamatergic%20Neurons_VGLUT2(G)_MAP2(R)_Tubb3(B)_Hoechst(B)_20x_merge-comp.jpg)
_MAP2(R)_DAPI(B)_%20comp.jpg?width=604&name=a-HTT50CAGWT_Overlay__TUBB3(G)_MAP2(R)_DAPI(B)_%20comp.jpg)
_MAP2(R)_DAPI(B)_%20(1).png?width=600&height=378&name=a-HTT50CAGWT_Overlay__TUBB3(G)_MAP2(R)_DAPI(B)_%20(1).png)