Human iPSC-derived GABAergic neurons


cat no | io1003
Human iPSC-derived GABAergic neurons
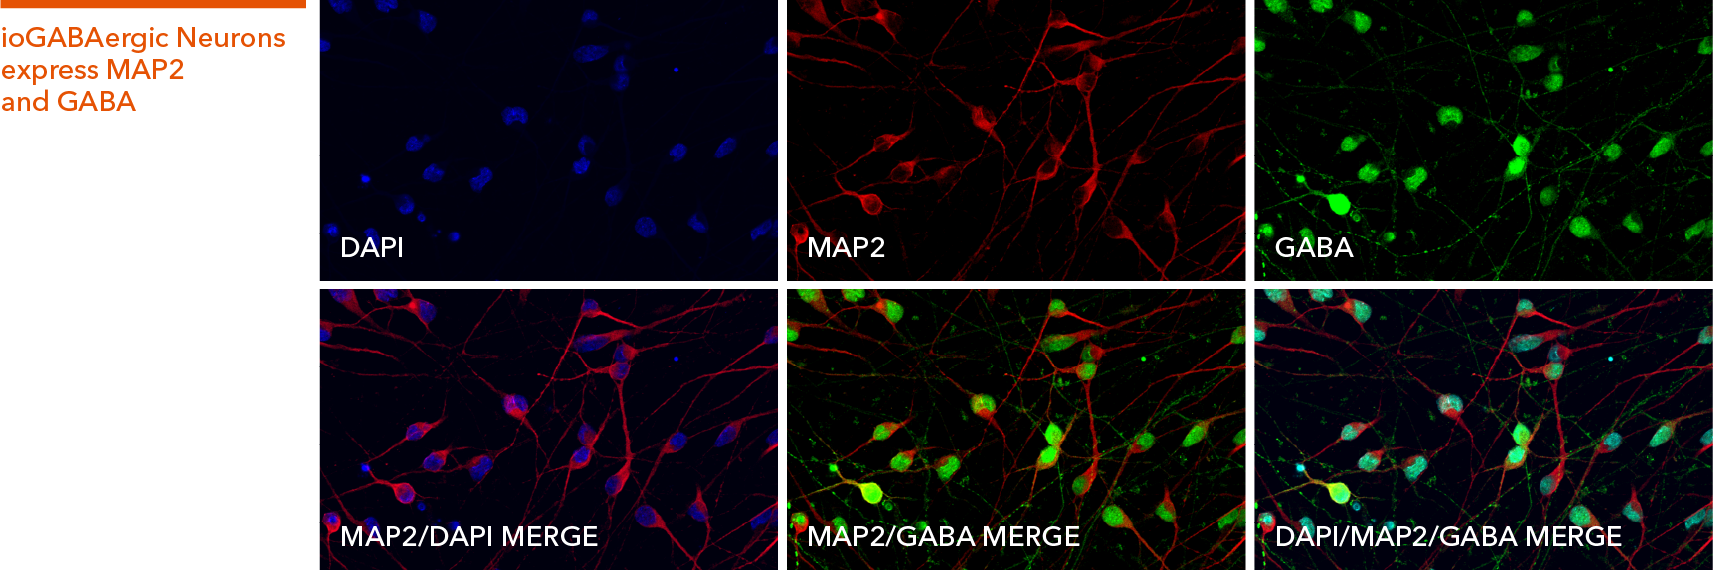
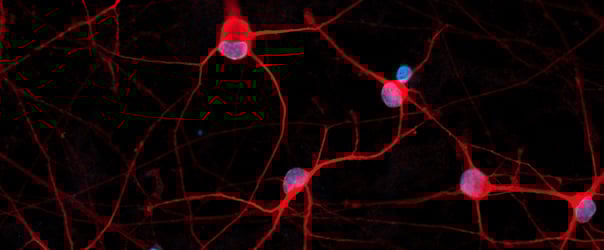
ioGABAergic Neurons express key GABAergic neuron-specific markers
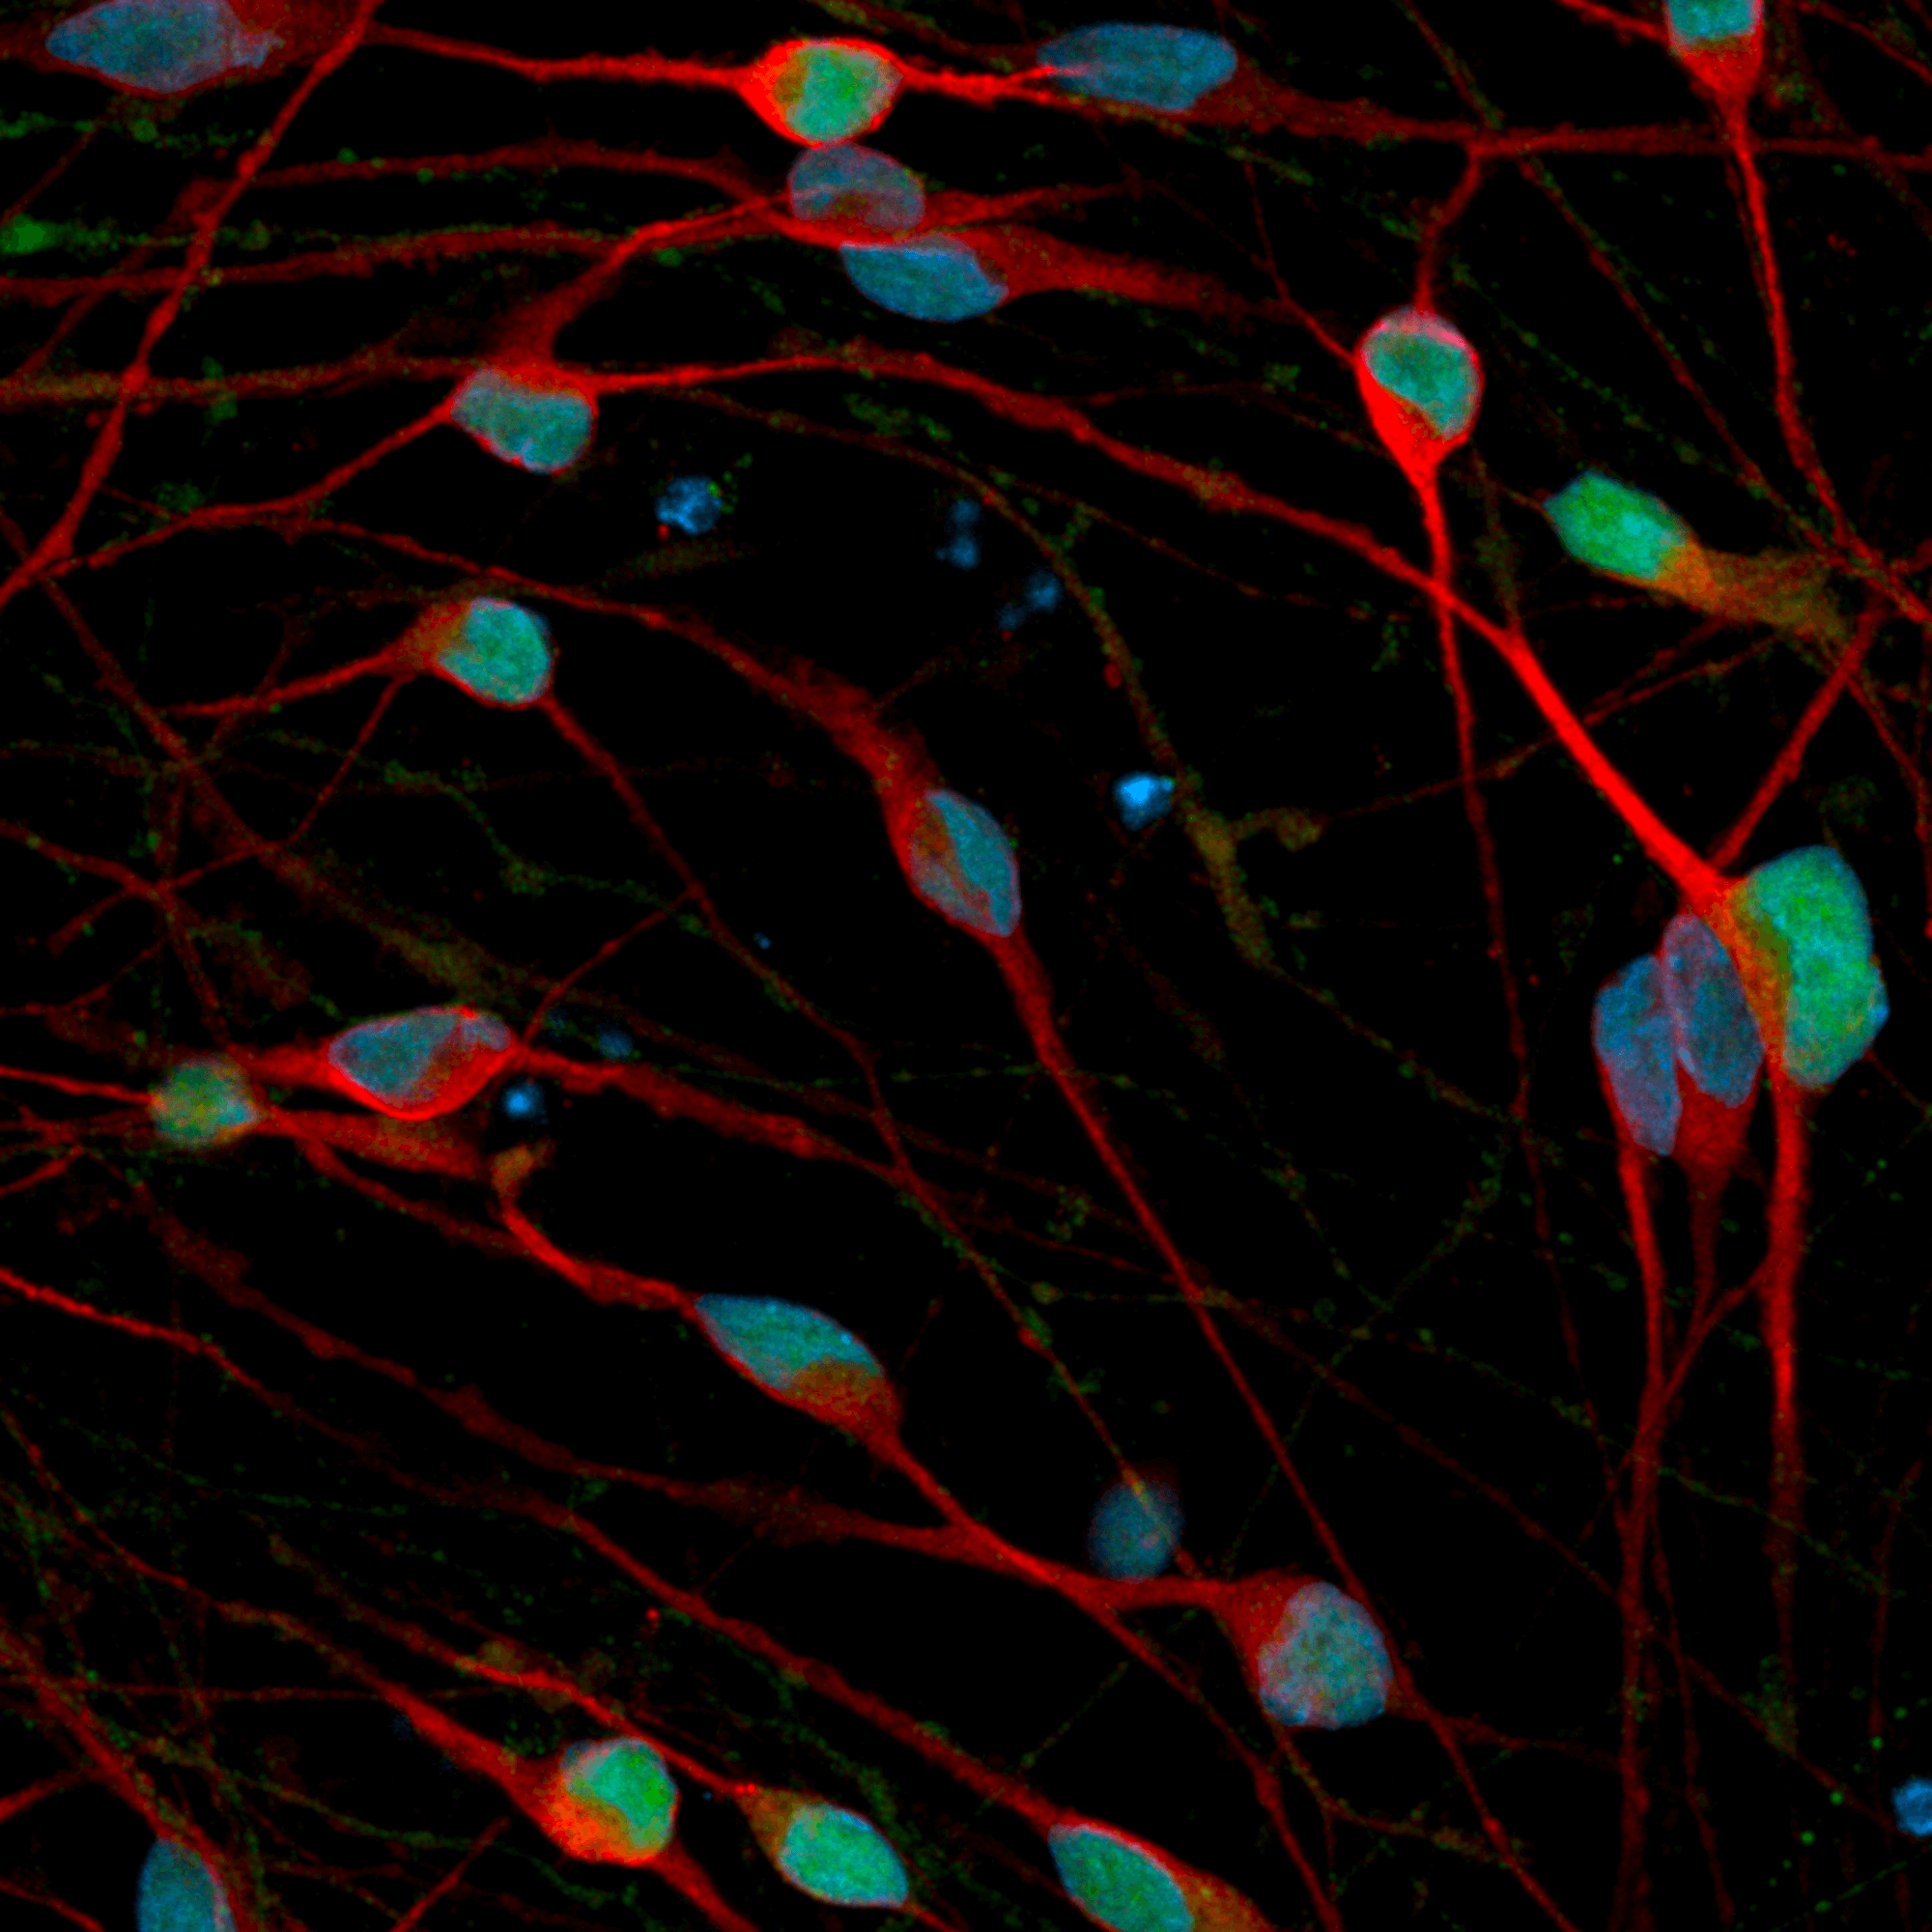
Immunofluorescent staining of ioGABAergic Neurons at day 12 post-revival. The upper panel shows that ioGABAergic Neurons are positive for the pan-neuronal marker MAP2 (red), GABA (green), and the DAPI counterstain (blue). The lower panel shows that all MAP2 positive neurons have a GABAergic neuronal identity.
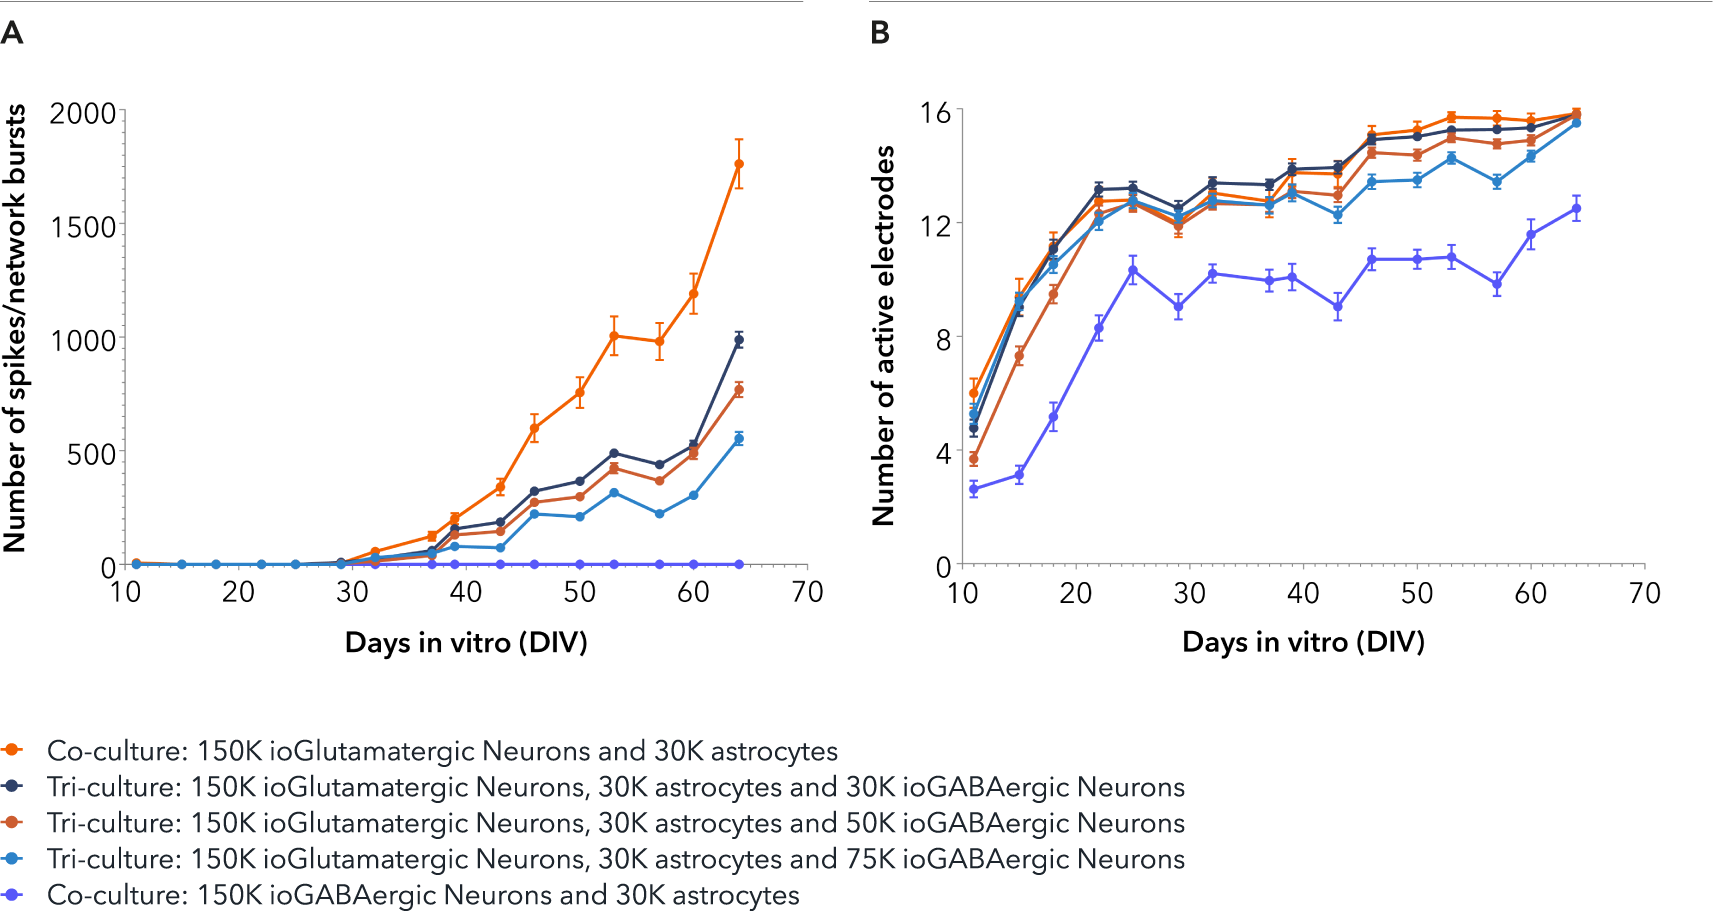
ioGABAergic Neurons form functional neuronal networks and modulate network activity in tri-cultures with ioGlutamatergic Neurons and astrocytes
Tri-cultures containing increasing numbers of ioGABAergic Neurons, and a fixed number of ioGlutamatergic Neurons and hiPSC-derived astrocytes were thawed and seeded together into a 48-well CytoView MEA plate (Axion Biosystems). Control co-cultures consisted of either ioGABAergic Neurons and hiPSC-derived astrocytes or ioGlutamatergic Neurons and hiPSC-derived astrocytes. Analysis was performed on an Axion Maestro Pro MEA platform over a time period of 64 days in vitro (DIV). A. Co-cultures containing excitatory ioGlutamatergic Neurons and astrocytes show the strongest synchronised network activity, indicated by the highest number of spikes per network burst. The addition of increasing numbers of inhibitory ioGABAergic Neurons to the tri-cultures reduces this synchronised network activity of the excitatory ioGlutamatergic Neurons, as expected. The co-culture of ioGABAergic Neurons and astrocytes shows no network bursts, indicating the absence of excitatory neurons and that the population of ioGABAergic Neurons is highly pure. B. Both co-culture and tri-culture conditions show increasing spontaneous activity, as measured by an increase in the number of active electrodes up to 25 DIV, followed by a plateau, indicating sustained activity over the time period of 64 DIV. This data was generated in partnership with Charles River.
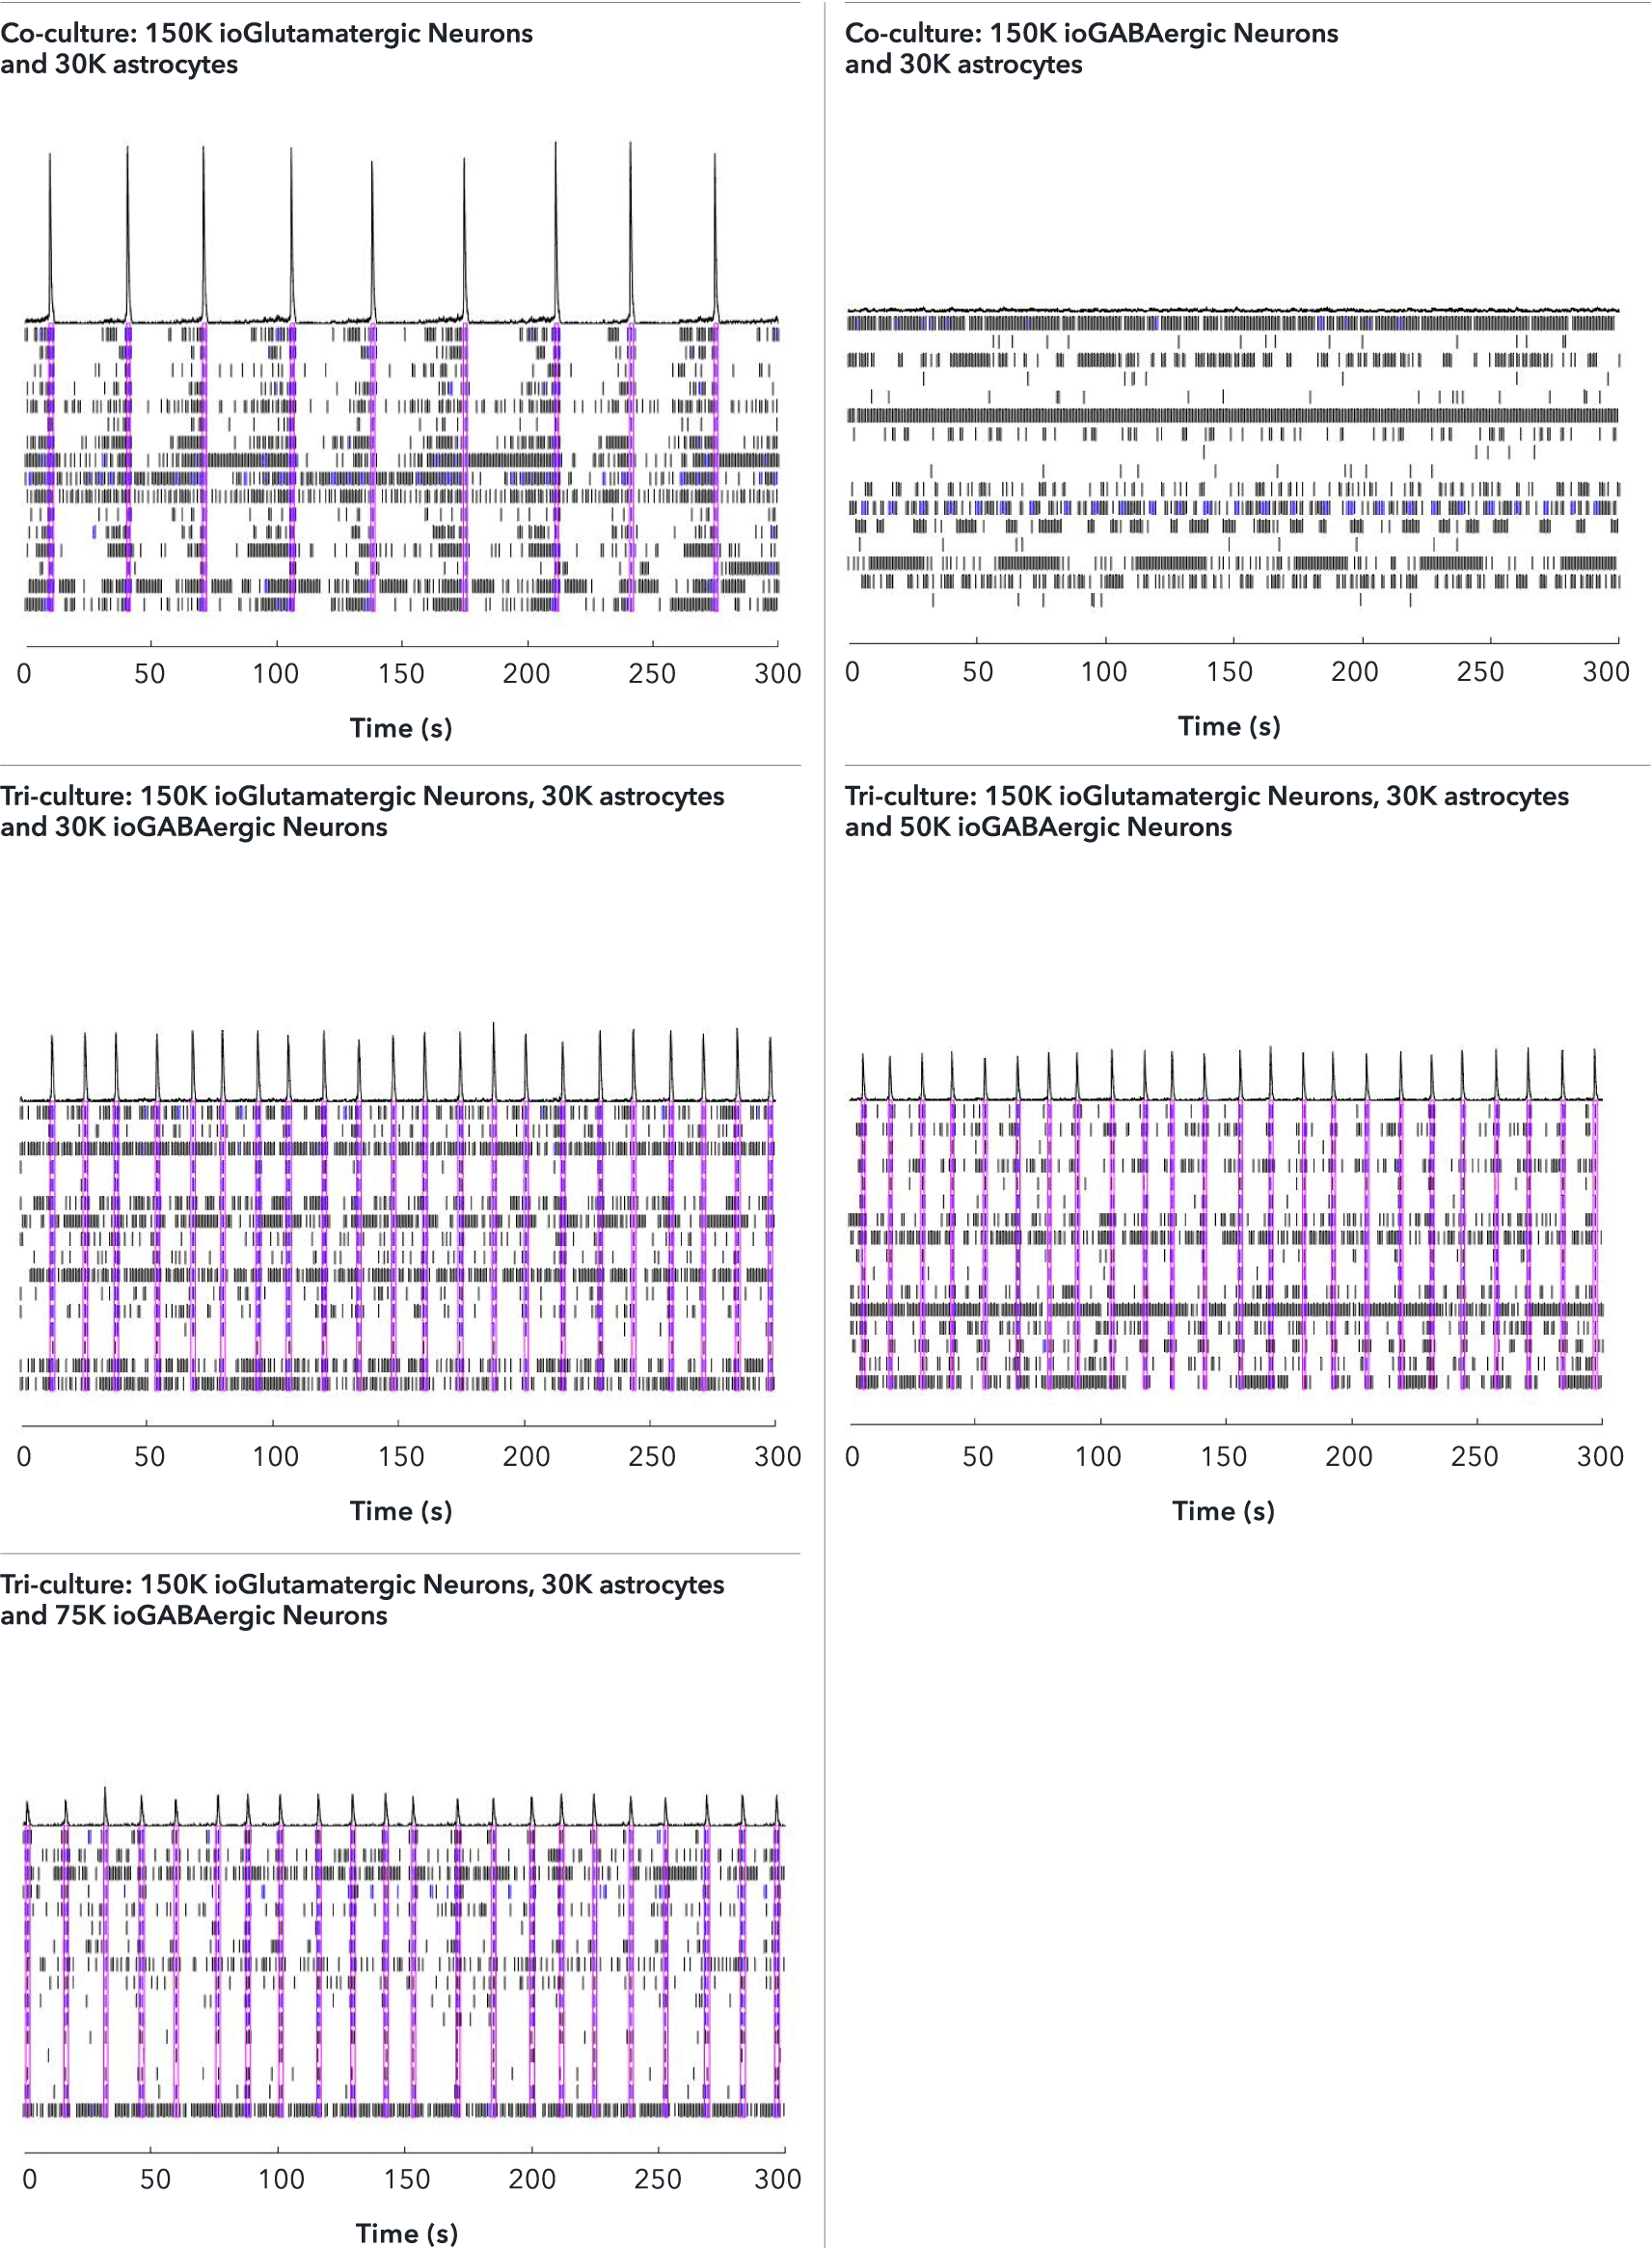
ioGABAergic Neurons exert an inhibitory effect on the excitatory ioGlutamatergic Neurons within the tri-cultures leading to a higher network burst rate
The effect of adding increasing numbers of inhibitory ioGABAergic Neurons to the tri-cultures was investigated by MEA analysis at 53 DIV, alongside the control co-cultures. Representative raster plots displaying the activity of 16 electrodes over a time period of 300 seconds are shown. Each horizontal row of the raster plot represents the activity of an electrode, within which each vertical black dash indicates a firing event, a blue dash indicates a single electrode burst, and a pink box indicates a network burst event. The histogram trace on top of the raster plot is a measure of the number of spikes per network burst. The co-culture with ioGlutamatergic Neurons and astrocytes shows the strongest network bursts as indicated by the increased number of spikes per network burst and shows a lower network burst rate (NBR) compared to the tri-cultures. The addition of increasing numbers of inhibitory ioGABAergic Neurons to the tri-cultures reduces the number of spikes per network burst and leads to an increased NBR. This indicates that ioGABAergic Neurons are having an inhibitory effect on the excitatory ioGlutamatergic Neurons. The co-culture of ioGABAergic Neurons and astrocytes shows no network bursts, indicating the absence of excitatory neurons and that the population of ioGABAergic Neurons is highly pure. Analysis was performed on an Axion Maestro Pro MEA platform. This data was generated in partnership with Charles River Laboratories.
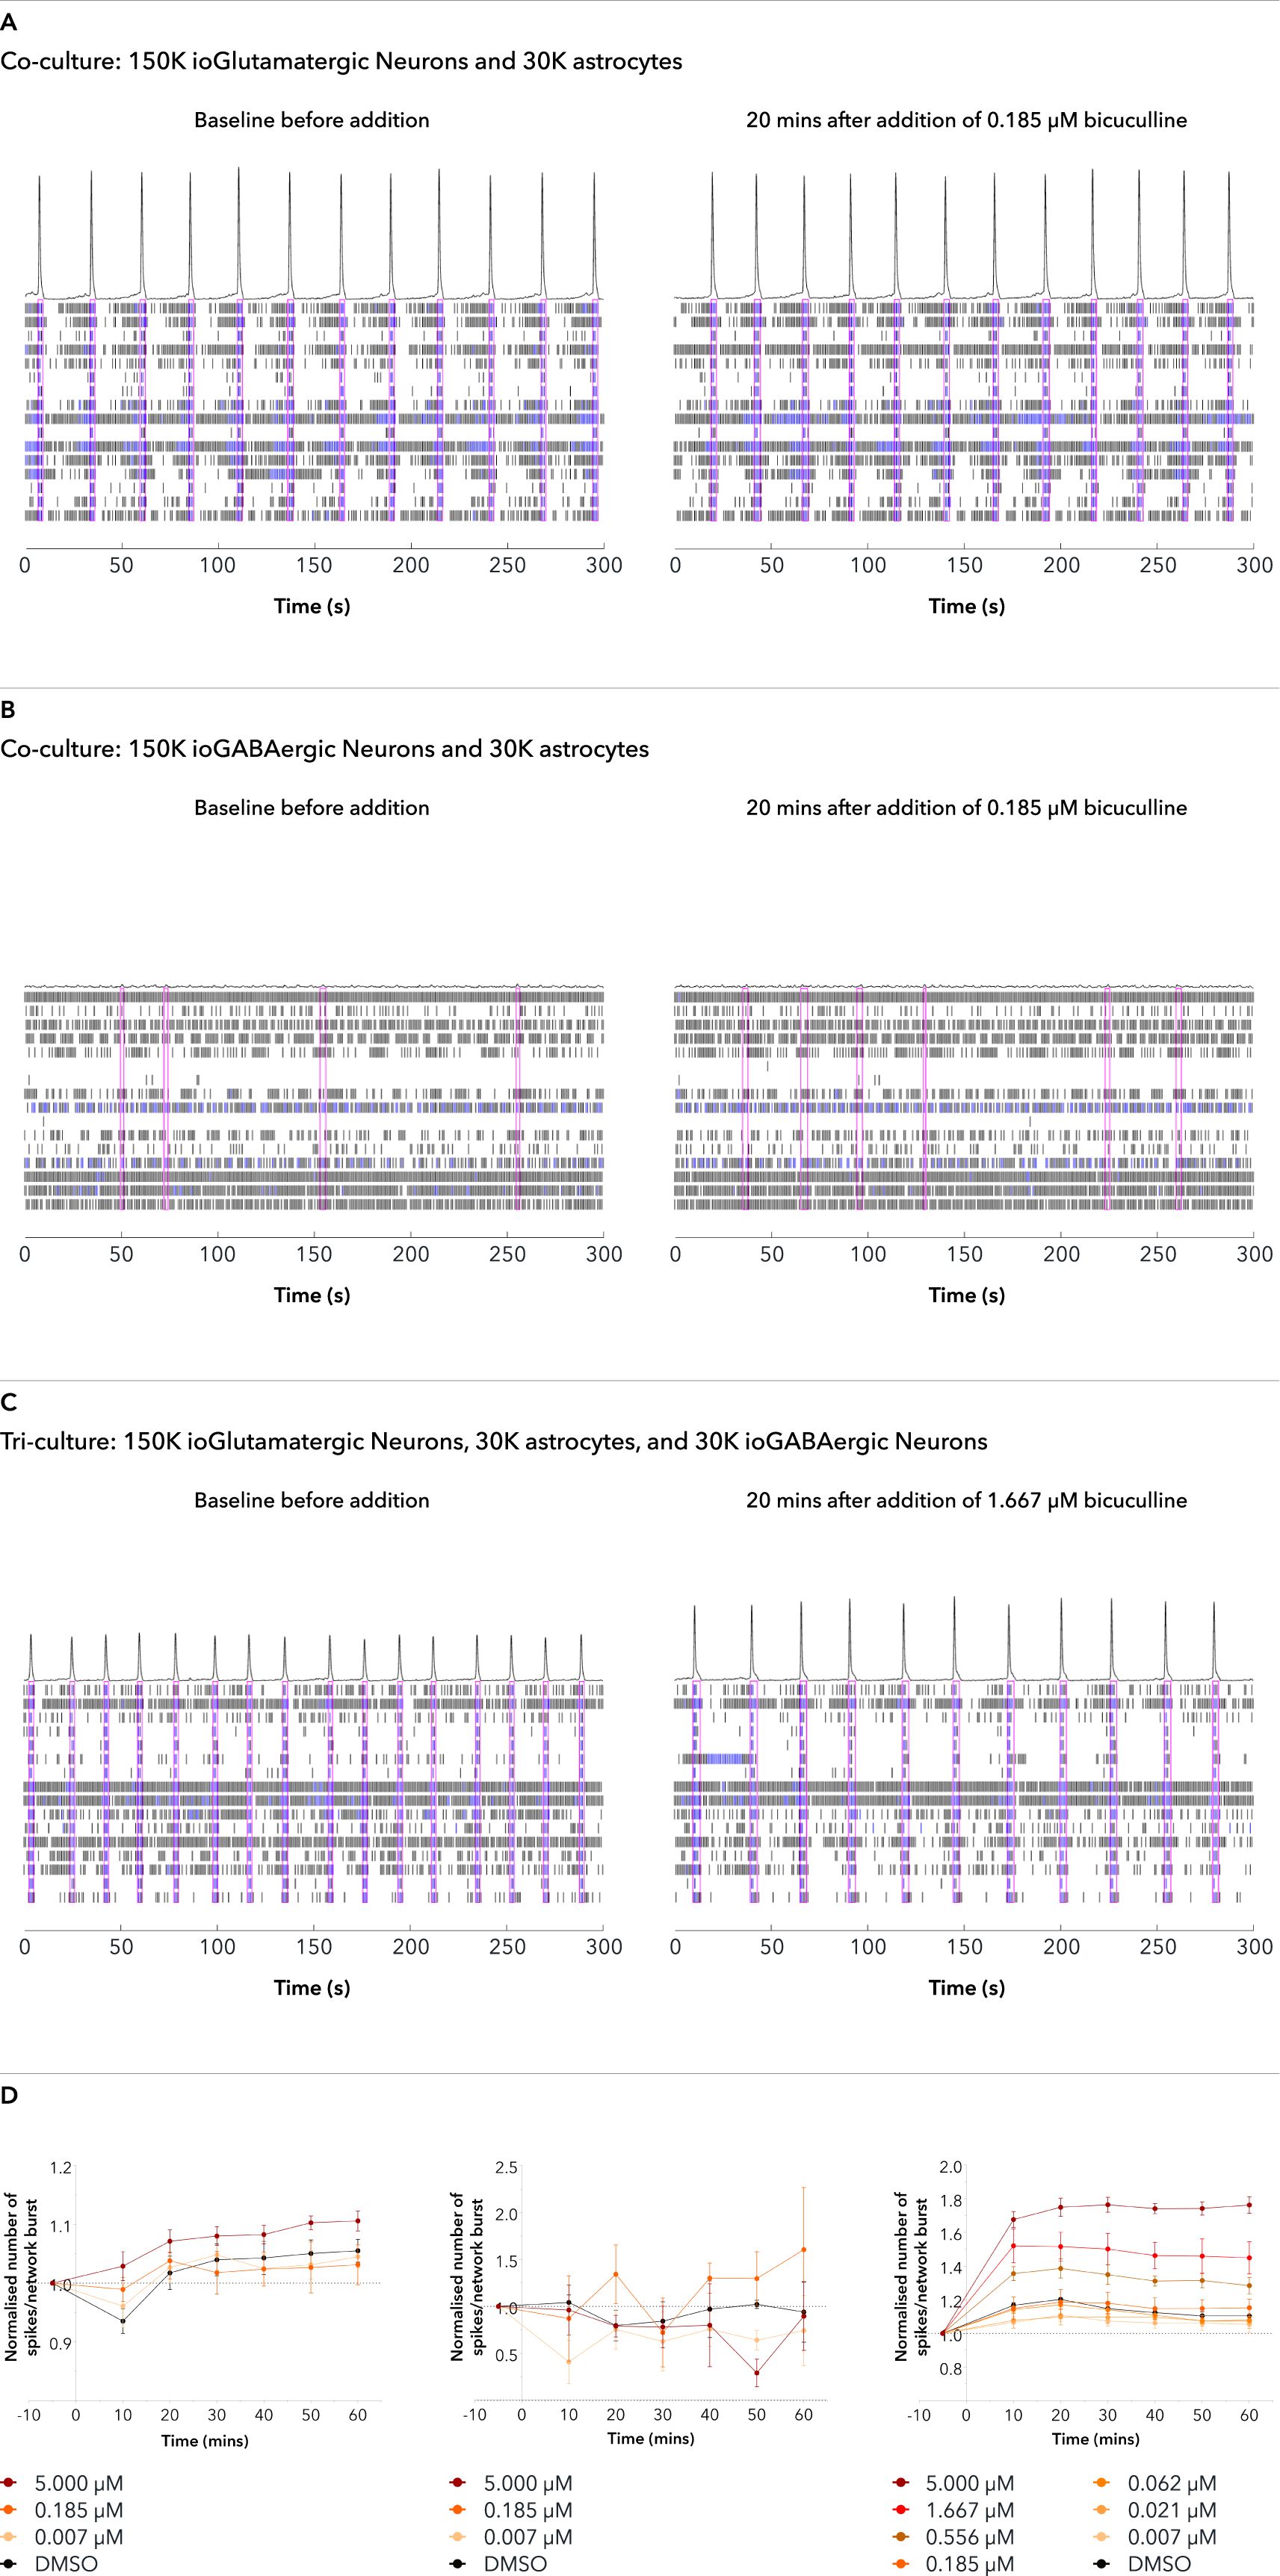
Addition of bicuculline, a competitive antagonist of GABAA receptors, to the tri-cultures releases the inhibitory effect of the ioGABAergic Neurons
The effect of adding bicuculline, a competitive antagonist of GABAA receptors, to the tri-cultures and control co-cultures was investigated by MEA analysis at 65 DIV. Representative raster plots displaying the activity of 16 electrodes over a time period of 300 seconds are shown before and 20 minutes after the addition of bicuculline. Each horizontal row of the raster plot represents the activity of an electrode, within which each vertical black dash indicates a firing event, a blue dash indicates a single electrode burst, and a pink box indicates a network burst event. The histogram trace on top of the raster plot is a measure of the number of spikes per network burst. A and B. The addition of bicuculline does not affect either co-culture condition, as expected. C. The antagonistic effect of bicuculline on GABAA receptors releases the inhibitory effect of the ioGABAergic Neurons within the tri-culture, thereby reducing the NBR and leading to an increase in the number of spikes per network burst. D. Graphs displaying the number of spikes per network burst over time after the addition of bicuculline show no change in either control co-culture condition (left and centre graphs). A dose dependent increase in the number of spikes per network burst is seen in the tri-culture (right graph). This data was generated in partnership with Charles River Laboratories.
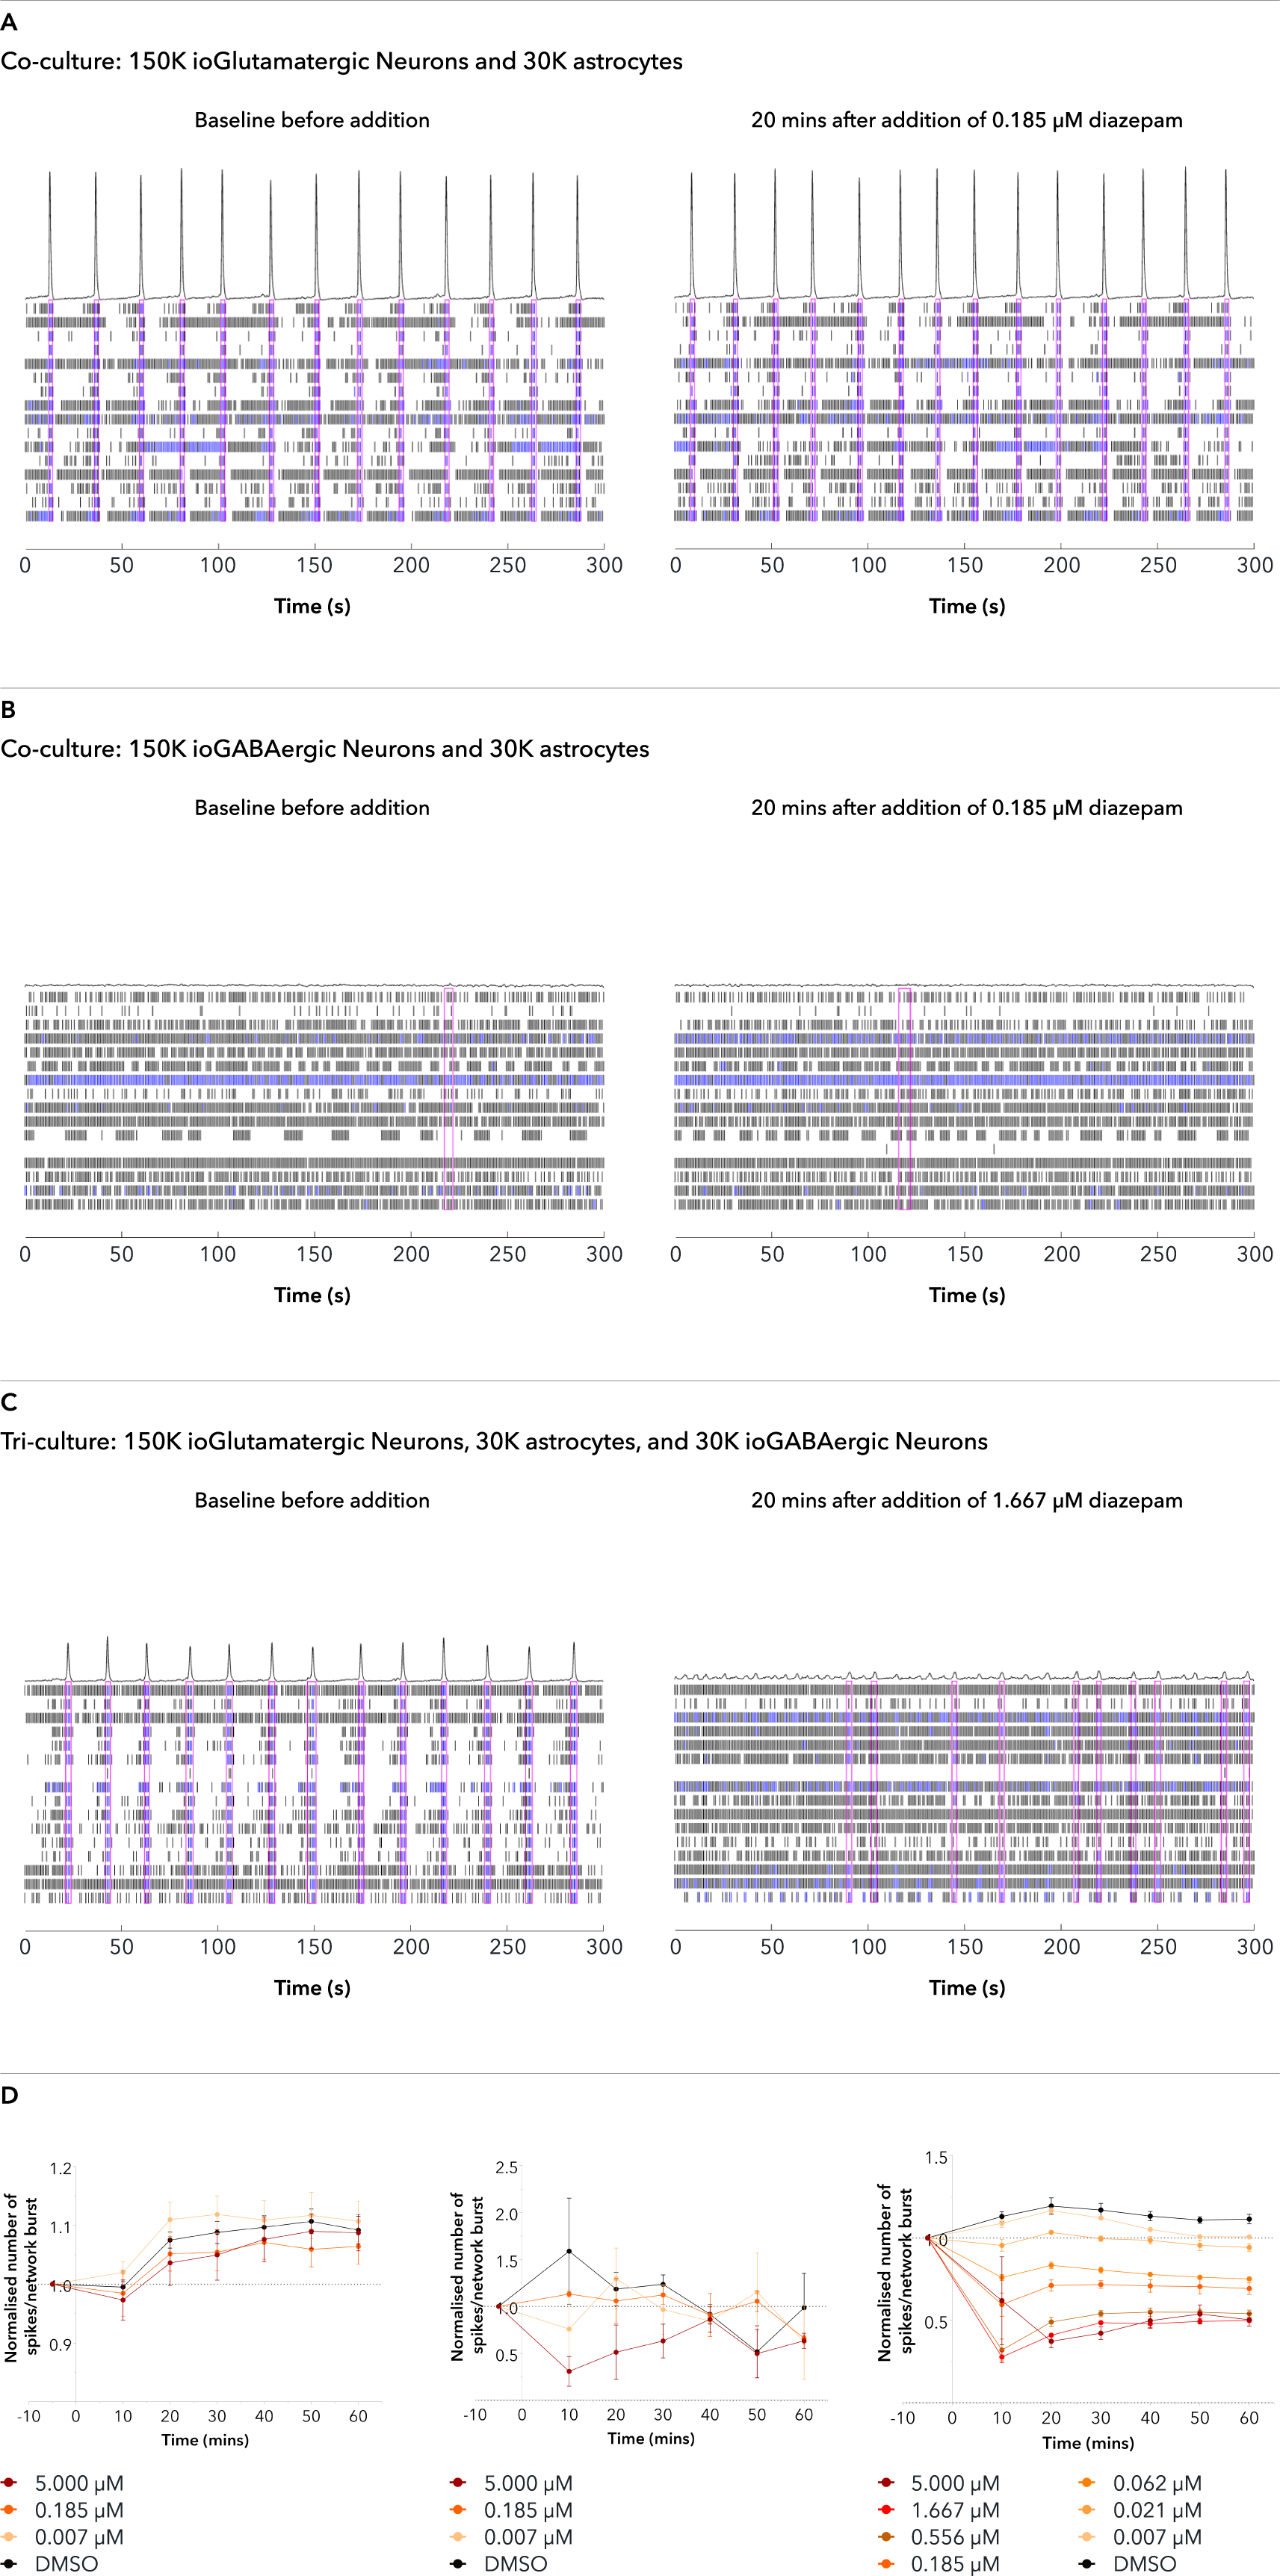
Addition of diazepam, a positive allosteric modulator of GABAA receptors, to the tri-cultures increases the inhibitory effect of the ioGABAergic Neurons
The effect of adding diazepam, a positive allosteric modulator of GABAA receptors, to the tri-cultures and control co-cultures was investigated by MEA analysis at 65 DIV. Representative raster plots displaying the activity of 16 electrodes over a time period of 300 seconds are shown before and 20 minutes after the addition of diazepam. Each horizontal row of the raster plot represents the activity of an electrode, within which each vertical black dash indicates a firing event, a blue dash indicates a single electrode burst, and a pink box indicates a network burst event. The histogram trace on top of the raster plot is a measure of the number of spikes per network burst. A and B. The addition of diazepam does not affect either co-culture condition, as expected. C. The inhibitory effect of ioGABAergic Neurons on the tri-cultures is increased by the positive modulatory effect of diazepam, shown by the sharp decrease in the number of spikes per network burst and a decrease in the NBR. D. Graphs displaying the number of spikes per network burst over time after the addition of diazepam shows no change in either control co-culture condition (left and centre graphs). The number of spikes per network burst decreases to zero and makes all bursting disordered in the tri-culture (right graph). Analysis was performed on an Axion Maestro Pro MEA platform. This data was generated in partnership with Charles River Laboratories.
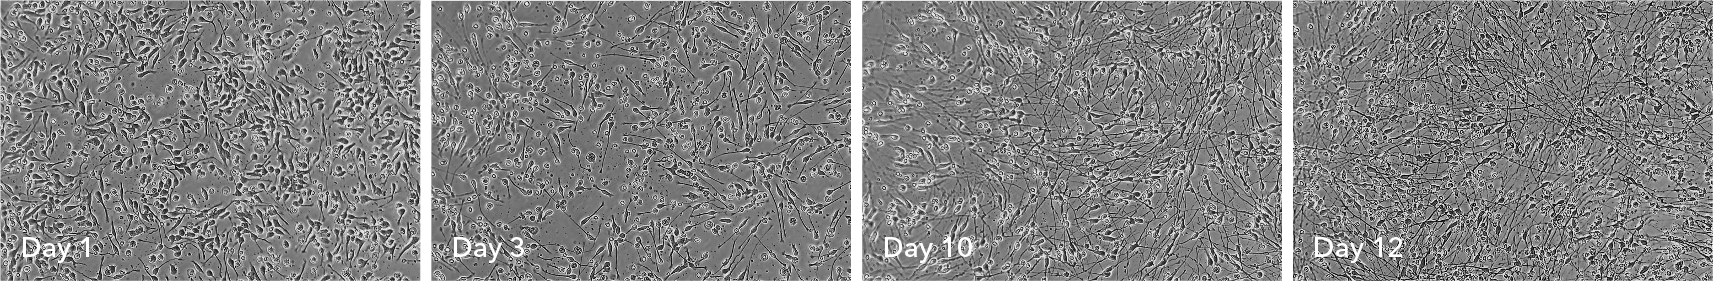
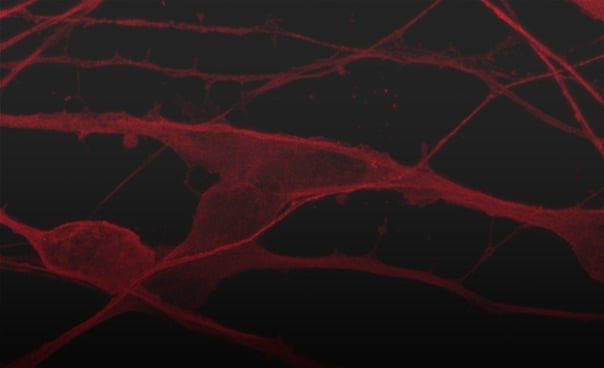
ioGABAergic Neurons show visible neuronal networks by day 10
Upon reprogramming, rapid morphological changes are observed in the cells, with neurons identified by day 3 post-revival. Visible neuronal networks are observed by day 10 post-thaw. Images show day 1 to 12 post-thawing; 100X magnification.
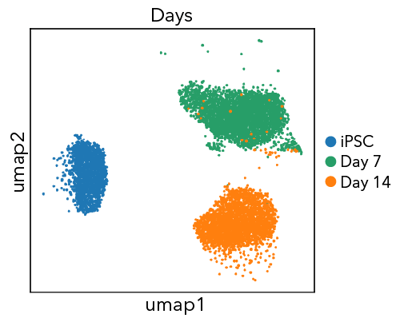
Single cell RNA-sequencing shows ioGABAergic Neurons form a pure population (>99%) of GABAergic neurons
Single cell RNA-sequencing analysis was performed with ioGABAergic Neurons at three specific timepoints (day 0, 7 and 14). By day 7, the population has a distinct expression profile indicating a pure population (>99%) of post-mitotic GABAergic neurons. Gene expression was assessed by 10x Genomics scRNA-sequencing. Note, this data is from cells in continuous culture, so minor variations may exist between this data and data from cryopreserved cells.
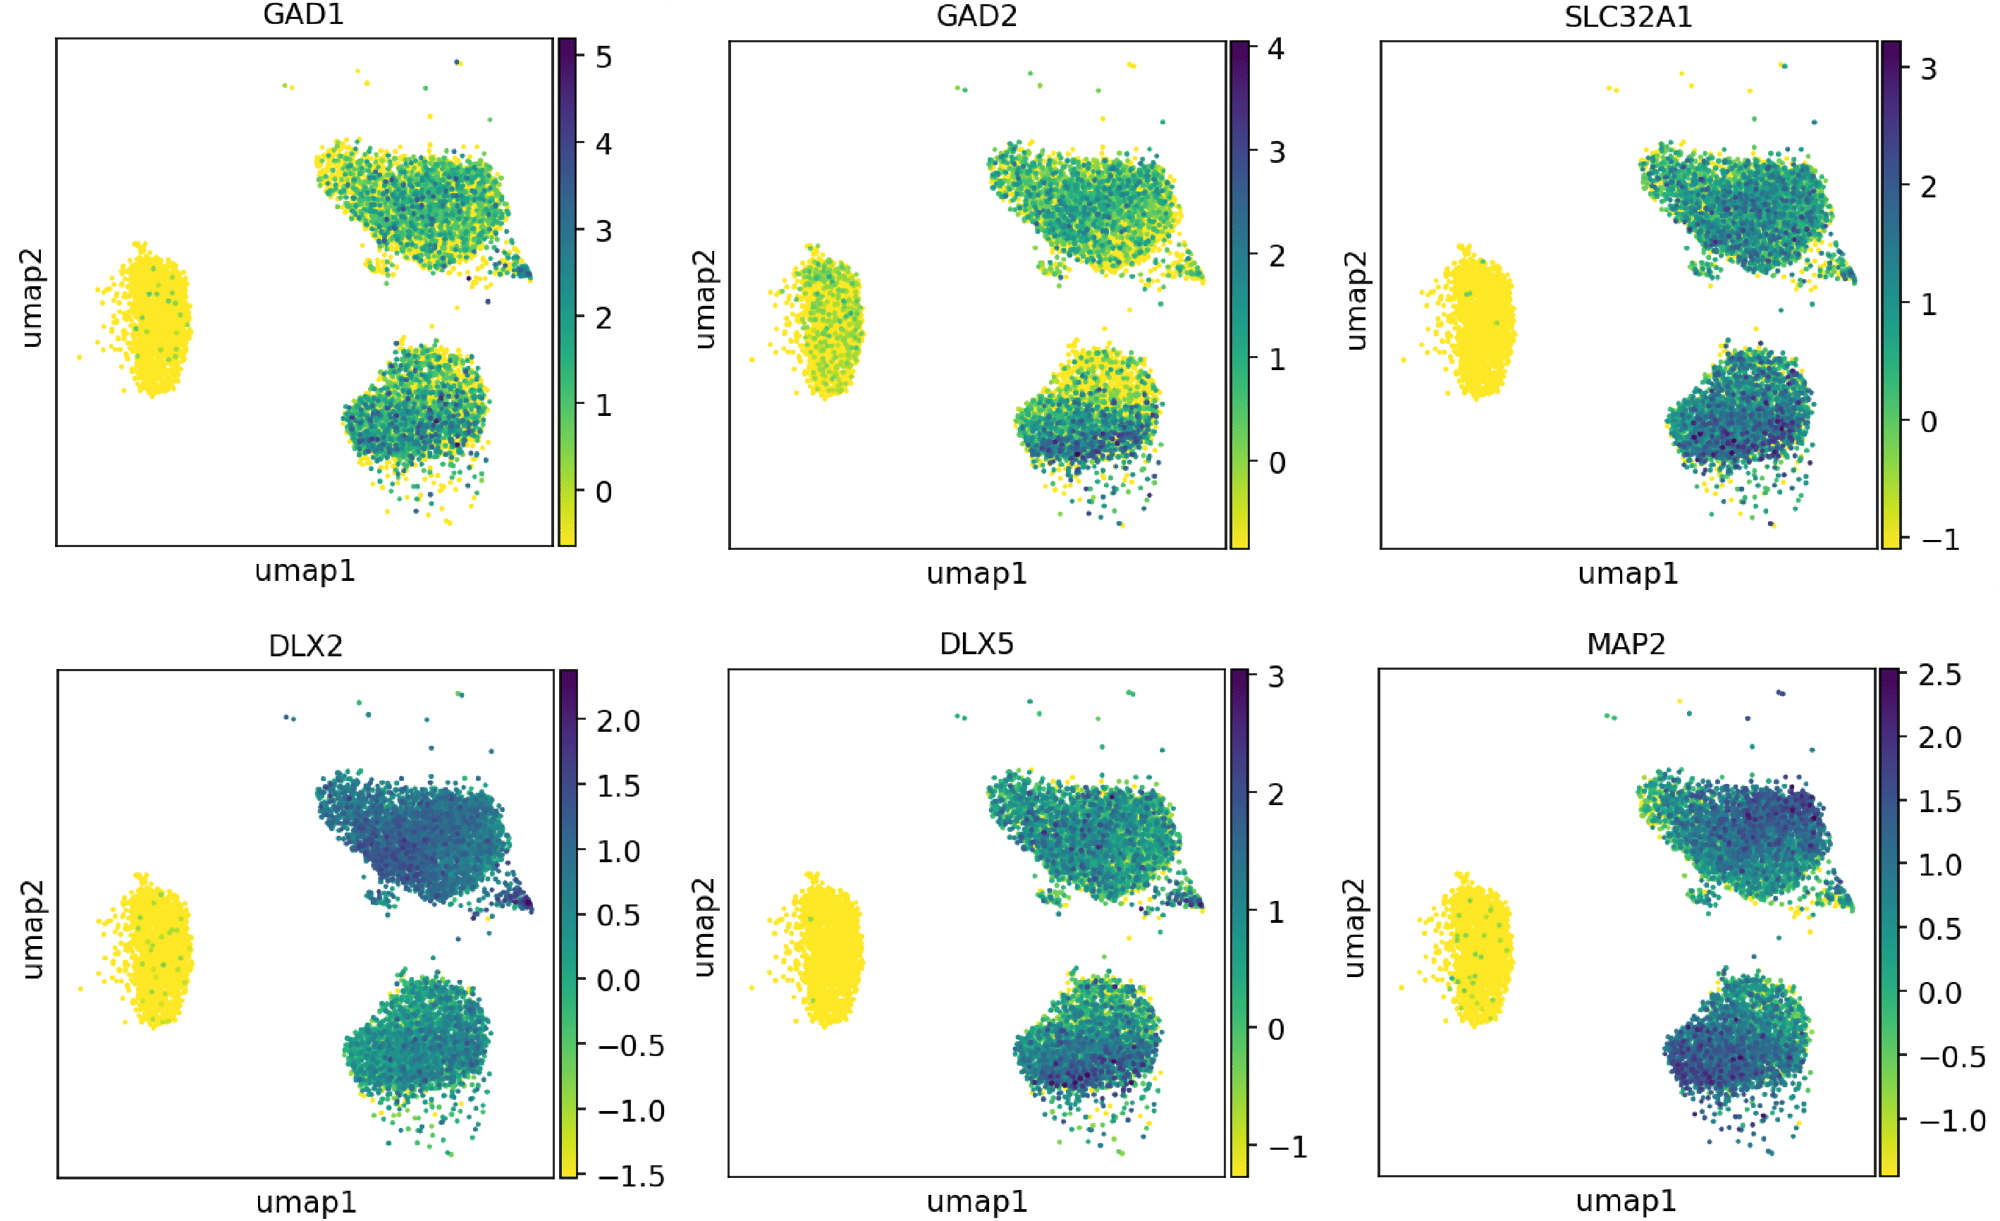
Single cell RNA-sequencing shows ioGABAergic Neurons express key GABAergic markers
Single cell RNA-sequencing analysis was performed with ioGABAergic Neurons at three specific timepoints (day 0, 7 and 14). By day 7, the expression of key GABAergic marker genes [GAD1, GAD2, SLC32A1 (VGAT), DLX2, DLX5], together with the pan-neuronal marker MAP2, could be detected in post-mitotic GABAergic neurons. Gene expression was assessed by 10x Genomics scRNA-sequencing. Note, this data is from cells in continuous culture, so minor variations may exist between this data and data from cryopreserved cells.
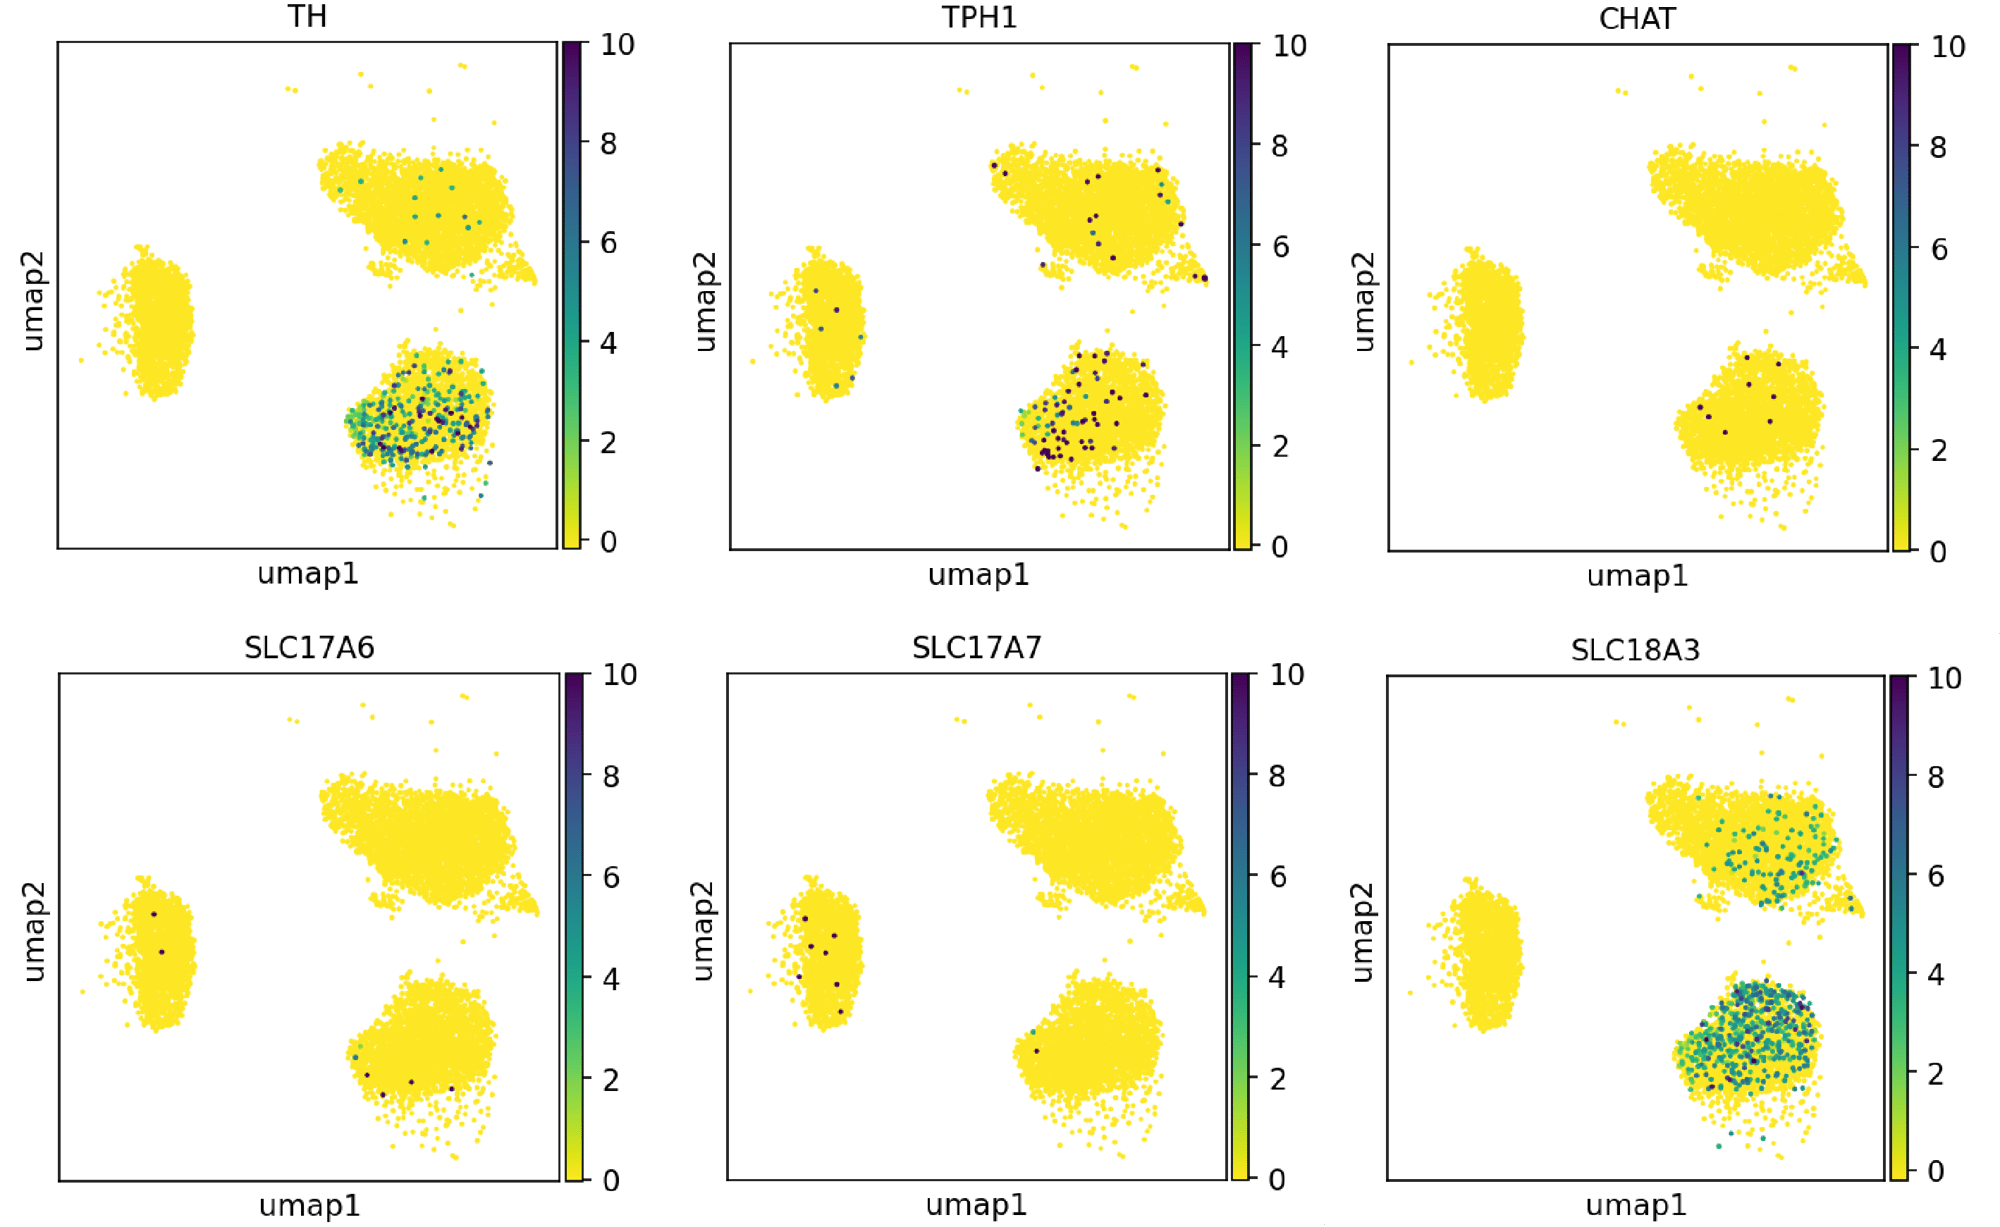
Single cell RNA-sequencing shows ioGABAergic Neurons display minimal expression of markers indicative of other neuronal lineages
Single cell RNA-sequencing analysis was performed with ioGABAergic Neurons at three specific timepoints (day 0, 7 and 14). By day 14, the expression of markers of non-GABAergic neuronal lineages [TH - dopaminergic, TPH1 - serotonergic, CHAT - cholinergic, SLC17A6 (VGLUT2) - glutamatergic, SLC17A7 (VGLUT1) - glutamatergic, SLC18A3 (VACHT) - cholinergic] are largely absent. Gene expression was assessed by 10x Genomics scRNA-sequencing. Note, this data is from cells in continuous culture, so minor variations may exist between this data and data from cryopreserved cells.
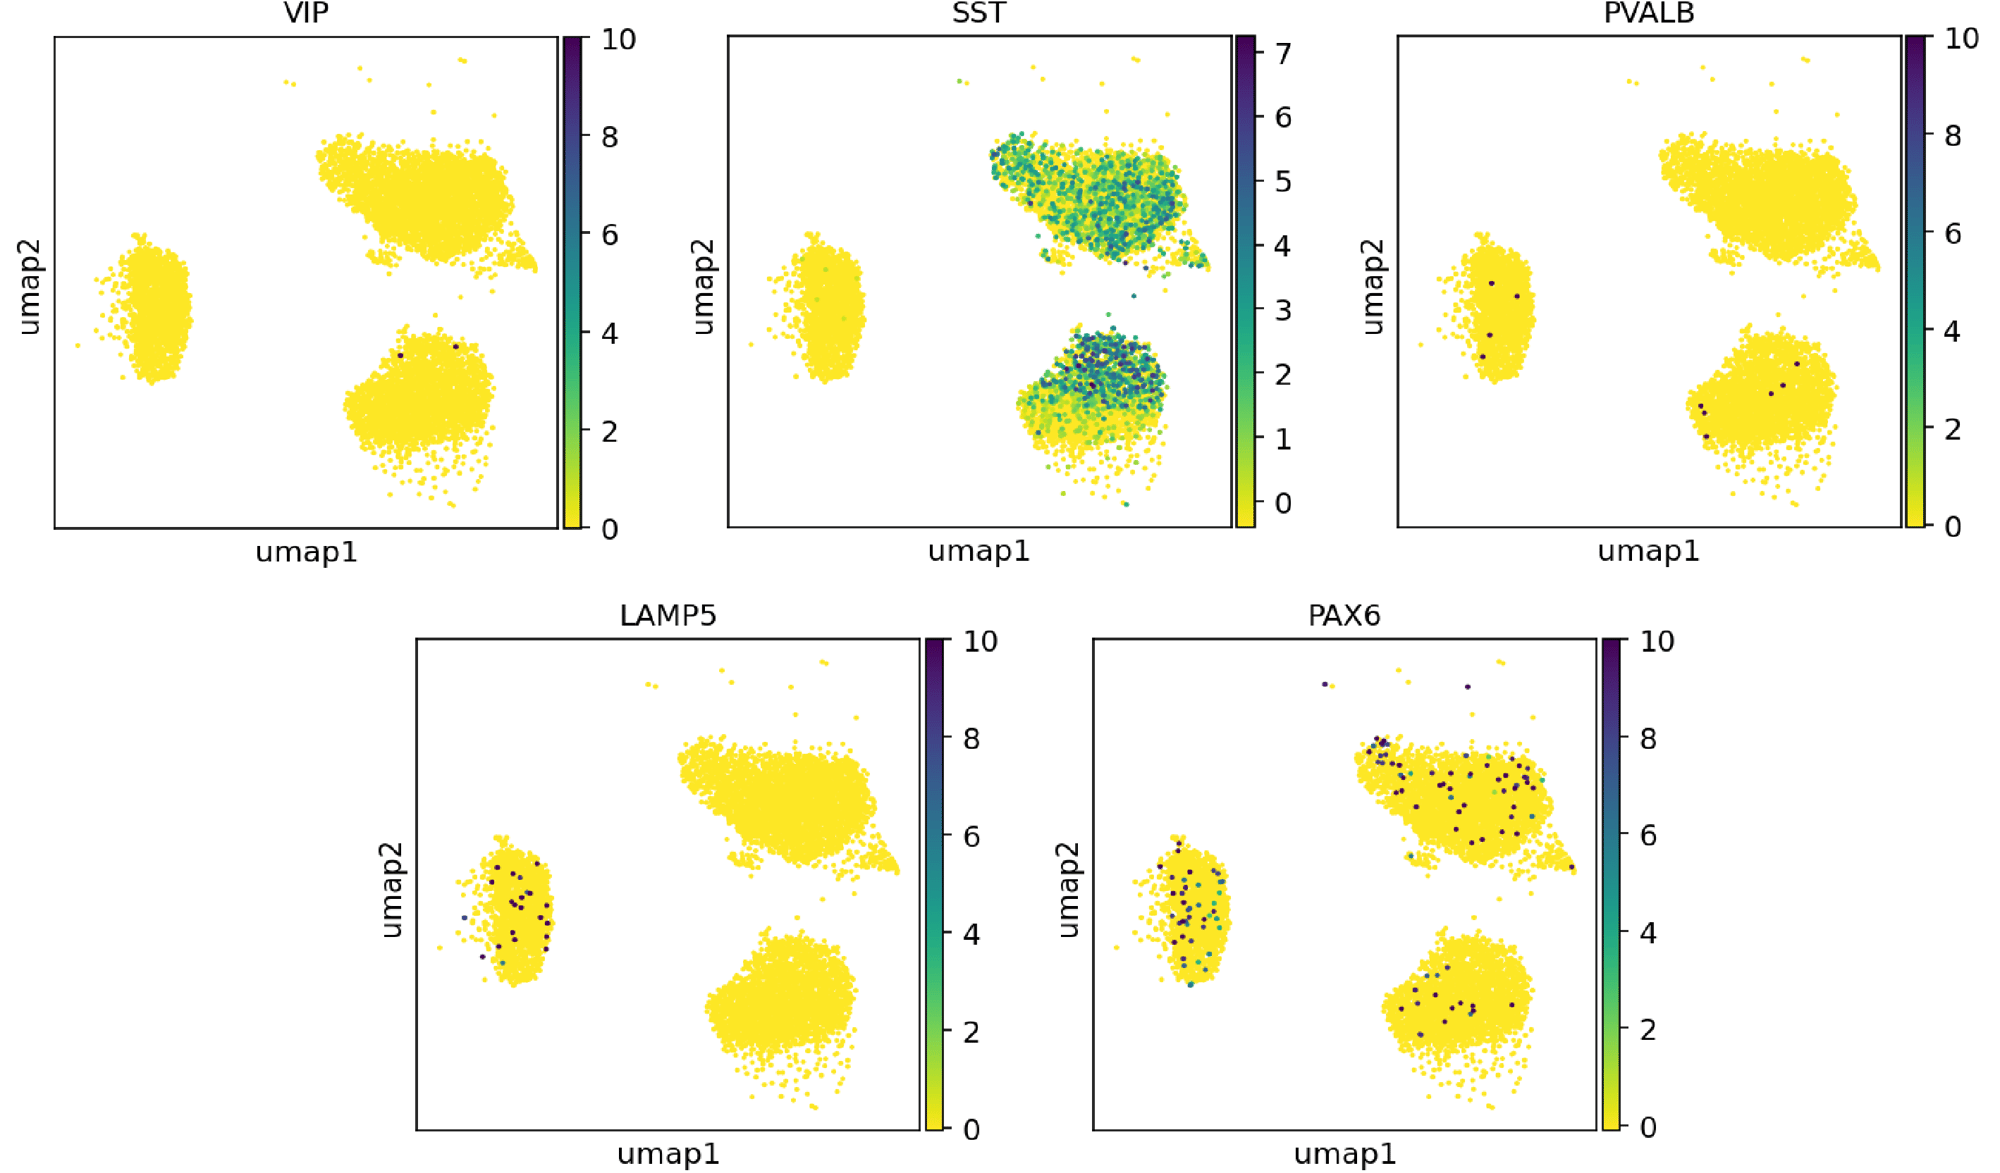
Single cell RNA-sequencing indicates that ioGABAergic Neurons are of the SST sub-type
Single cell RNA-sequencing analysis was performed with ioGABAergic Neurons at three specific timepoints (day 0, 7 and 14). By day 7, cells appear to largely express the somatostatin (SST) marker indicating that this population is of the SST sub-type. Gene expression was assessed by 10x Genomics scRNA-sequencing. Note, this data is from cells in continuous culture, so minor variations may exist between this data and data from cryopreserved cells.
Whole transcriptome analysis demonstrates high lot-to-lot consistency of ioGABAergic Neurons
Bulk RNA sequencing analysis was performed on three technical replicates of three independent lots of ioGABAergic Neurons at different time points throughout the reprogramming protocol. Principal component analysis represents the variance in gene expression between the lots of ioGABAergic Neurons. This analysis shows high consistency between each lot of ioGABAergic Neurons at each given timepoint. Differential gene expression analysis shows only 9 or less differentially expressed genes between lots, less than <1% of the total 25,000 genes within a human cell, at day 12 post-thaw. Pure populations of ioGABAergic Neurons with equivalent expression profiles can be generated consistently from every vial, allowing confidence in experimental reproducibility.
A maximum number of 20 vials applies. If you would like to order more than 20 vials, please contact us at orders@bit.bio.
Highly Pure
>99% of cells express key GABAergic markers within 4 days post-thaw, confirmed by single cell RNA sequencing.
Consistent
Get reproducible results from every vial with high lot-to-lot consistency, with less than 1% differentially expressed genes between lots, confirmed by bulk-RNA sequencing.
Co-culture compatible
Forms functional neuronal networks within co-cultures with ioGlutamatergic Neurons and astrocytes as shown by microelectrode array (MEA) analysis.

ioGABAergic Neurons are delivered in a cryopreserved format and are programmed to rapidly mature upon revival in the recommended media. The protocol for the generation of these cells is a two-phase process: Induction, which is carried out at bit.bio, Stabilisation for 3 days (Phase 1), and Maintenance (Phase 2) during which the ioGABAergic Neurons mature. Phases 1 and 2 after revival of cells are carried out at the customer site.

Rodney A. Bowling Jr., Ph.D.
Co-Founder & Chief Scientific Officer | Everlum Bio
opti-ox precision deterministically programmed ioGABAergic Neurons rapidly form a homogenous neuronal population
Time-lapse video capturing the rapid and homogeneous neuronal phenotype acquisition upon thawing of cryopreserved ioGABAergic Neurons (12 day time course).
ioGABAergic Neurons express key GABAergic neuron-specific markers
Immunofluorescent staining of ioGABAergic Neurons at day 12 post-revival. The upper panel shows that ioGABAergic Neurons are positive for the pan-neuronal marker MAP2 (red), GABA (green), and the DAPI counterstain (blue). The lower panel shows that all MAP2 positive neurons have a GABAergic neuronal identity.
ioGABAergic Neurons show visible neuronal networks by day 10
Upon reprogramming, rapid morphological changes are observed in the cells, with neurons identified by day 3 post-revival. Visible neuronal networks are observed by day 10 post-thaw. Images show day 1 to 12 post-thawing; 100X magnification.
Single cell RNA-sequencing shows ioGABAergic Neurons form a pure population (>99%) of GABAergic neurons
Single cell RNA-sequencing analysis was performed with ioGABAergic Neurons at three specific timepoints (day 0, 7 and 14). By day 7, the population has a distinct expression profile indicating a pure population (>99%) of post-mitotic GABAergic neurons. Gene expression was assessed by 10x Genomics scRNA-sequencing. Note, this data is from cells in continuous culture, so minor variations may exist between this data and data from cryopreserved cells.
Single cell RNA-sequencing shows ioGABAergic Neurons express key GABAergic markers
Single cell RNA-sequencing analysis was performed with ioGABAergic Neurons at three specific timepoints (day 0, 7 and 14). By day 7, the expression of key GABAergic marker genes [GAD1, GAD2, SLC32A1 (VGAT), DLX2, DLX5], together with the pan-neuronal marker MAP2, could be detected in post-mitotic GABAergic neurons. Gene expression was assessed by 10x Genomics scRNA-sequencing. Note, this data is from cells in continuous culture, so minor variations may exist between this data and data from cryopreserved cells.
Single cell RNA-sequencing shows ioGABAergic Neurons display minimal expression of markers indicative of other neuronal lineages
Single cell RNA-sequencing analysis was performed with ioGABAergic Neurons at three specific timepoints (day 0, 7 and 14). By day 14, the expression of markers of non-GABAergic neuronal lineages [TH - dopaminergic, TPH1 - serotonergic, CHAT - cholinergic, SLC17A6 (VGLUT2) - glutamatergic, SLC17A7 (VGLUT1) - glutamatergic, SLC18A3 (VACHT) - cholinergic] are largely absent. Gene expression was assessed by 10x Genomics scRNA-sequencing. Note, this data is from cells in continuous culture, so minor variations may exist between this data and data from cryopreserved cells.
Single cell RNA-sequencing indicates that ioGABAergic Neurons are of the SST sub-type
Whole transcriptome analysis demonstrates high lot-to-lot consistency of ioGABAergic Neurons

Bulk RNA sequencing analysis was performed on three technical replicates of three independent lots of ioGABAergic Neurons at different time points throughout the reprogramming protocol. Principal component analysis represents the variance in gene expression between the lots of ioGABAergic Neurons. This analysis shows high consistency between each lot of ioGABAergic Neurons at each given timepoint. Differential gene expression analysis shows only 9 or less differentially expressed genes between lots, less than <1% of the total 25,000 genes within a human cell, at day 12 post-thaw. Pure populations of ioGABAergic Neurons with equivalent expression profiles can be generated consistently from every vial, allowing confidence in experimental reproducibility.
Calcium imaging of ioGABAergic Neurons demonstrates spontaneous activity
Video showing spontaneous activity of ioGABAergic Neurons, subjected to calcium imaging at day 16 post-revival.
ioGABAergic Neurons form functional neuronal networks and modulate network activity in tri-cultures with ioGlutamatergic Neurons and astrocytes
Tri-cultures containing increasing numbers of ioGABAergic Neurons, and a fixed number of ioGlutamatergic Neurons and hiPSC-derived astrocytes were thawed and seeded together into a 48-well CytoView MEA plate (Axion Biosystems). Control co-cultures consisted of either ioGABAergic Neurons and hiPSC-derived astrocytes or ioGlutamatergic Neurons and hiPSC-derived astrocytes. Analysis was performed on an Axion Maestro Pro MEA platform over a time period of 64 days in vitro (DIV). A. Co-cultures containing excitatory ioGlutamatergic Neurons and astrocytes show the strongest synchronised network activity, indicated by the highest number of spikes per network burst. The addition of increasing numbers of inhibitory ioGABAergic Neurons to the tri-cultures reduces this synchronised network activity of the excitatory ioGlutamatergic Neurons, as expected. The co-culture of ioGABAergic Neurons and astrocytes shows no network bursts, indicating the absence of excitatory neurons and that the population of ioGABAergic Neurons is highly pure. B. Both co-culture and tri-culture conditions show increasing spontaneous activity, as measured by an increase in the number of active electrodes up to 25 DIV, followed by a plateau, indicating sustained activity over the time period of 64 DIV. This data was generated in partnership with Charles River.
ioGABAergic Neurons exert an inhibitory effect on the excitatory ioGlutamatergic Neurons within the tri-cultures leading to a higher network burst rate
The effect of adding increasing numbers of inhibitory ioGABAergic Neurons to the tri-cultures was investigated by MEA analysis at 53 DIV, alongside the control co-cultures. Representative raster plots displaying the activity of 16 electrodes over a time period of 300 seconds are shown. Each horizontal row of the raster plot represents the activity of an electrode, within which each vertical black dash indicates a firing event, a blue dash indicates a single electrode burst, and a pink box indicates a network burst event. The histogram trace on top of the raster plot is a measure of the number of spikes per network burst. The co-culture with ioGlutamatergic Neurons and astrocytes shows the strongest network bursts as indicated by the increased number of spikes per network burst and shows a lower network burst rate (NBR) compared to the tri-cultures. The addition of increasing numbers of inhibitory ioGABAergic Neurons to the tri-cultures reduces the number of spikes per network burst and leads to an increased NBR. This indicates that ioGABAergic Neurons are having an inhibitory effect on the excitatory ioGlutamatergic Neurons. The co-culture of ioGABAergic Neurons and astrocytes shows no network bursts, indicating the absence of excitatory neurons and that the population of ioGABAergic Neurons is highly pure. Analysis was performed on an Axion Maestro Pro MEA platform. This data was generated in partnership with Charles River Laboratories.
Addition of bicuculline, a competitive antagonist of GABAA receptors, to the tri-cultures releases the inhibitory effect of the ioGABAergic Neurons
The effect of adding bicuculline, a competitive antagonist of GABAA receptors, to the tri-cultures and control co-cultures was investigated by MEA analysis at 65 DIV. Representative raster plots displaying the activity of 16 electrodes over a time period of 300 seconds are shown before and 20 minutes after the addition of bicuculline. Each horizontal row of the raster plot represents the activity of an electrode, within which each vertical black dash indicates a firing event, a blue dash indicates a single electrode burst, and a pink box indicates a network burst event. The histogram trace on top of the raster plot is a measure of the number of spikes per network burst. A and B. The addition of bicuculline does not affect either co-culture condition, as expected. C. The antagonistic effect of bicuculline on GABAA receptors releases the inhibitory effect of the ioGABAergic Neurons within the tri-culture, thereby reducing the NBR and leading to an increase in the number of spikes per network burst. D. Graphs displaying the number of spikes per network burst over time after the addition of bicuculline show no change in either control co-culture condition (left and centre graphs). A dose dependent increase in the number of spikes per network burst is seen in the tri-culture (right graph). This data was generated in partnership with Charles River Laboratories.
Addition of diazepam, a positive allosteric modulator of GABAA receptors, to the tri-cultures increases the inhibitory effect of the ioGABAergic Neurons
The effect of adding diazepam, a positive allosteric modulator of GABAA receptors, to the tri-cultures and control co-cultures was investigated by MEA analysis at 65 DIV. Representative raster plots displaying the activity of 16 electrodes over a time period of 300 seconds are shown before and 20 minutes after the addition of diazepam. Each horizontal row of the raster plot represents the activity of an electrode, within which each vertical black dash indicates a firing event, a blue dash indicates a single electrode burst, and a pink box indicates a network burst event. The histogram trace on top of the raster plot is a measure of the number of spikes per network burst. A and B. The addition of diazepam does not affect either co-culture condition, as expected. C. The inhibitory effect of ioGABAergic Neurons on the tri-cultures is increased by the positive modulatory effect of diazepam, shown by the sharp decrease in the number of spikes per network burst and a decrease in the NBR. D. Graphs displaying the number of spikes per network burst over time after the addition of diazepam shows no change in either control co-culture condition (left and centre graphs). The number of spikes per network burst decreases to zero and makes all bursting disordered in the tri-culture (right graph). Analysis was performed on an Axion Maestro Pro MEA platform. This data was generated in partnership with Charles River Laboratories.
Calcium imaging of ioGABAergic Neurons demonstrates spontaneous activity
Video showing spontaneous activity of ioGABAergic Neurons, subjected to calcium imaging at day 16 post-revival.

_MAP2(R)_Tubb3(B)_Hoechst(B)_20x_merge-comp.jpg?width=604&name=Colour%20webinar%20with%20it-bio%20ioGlutamatergic%20Neurons_VGLUT2(G)_MAP2(R)_Tubb3(B)_Hoechst(B)_20x_merge-comp.jpg)

In this webinar, Dr Rodney Bowling, CSO of Everlum Bio, offers an expert discussion on their use of ioGABAergic neurons for the screening of antisense oligonucleotide (ASO) based RNA therapeutics to accelerate the discovery of novel personalised therapies for rare autism spectrum disorders (ASD).
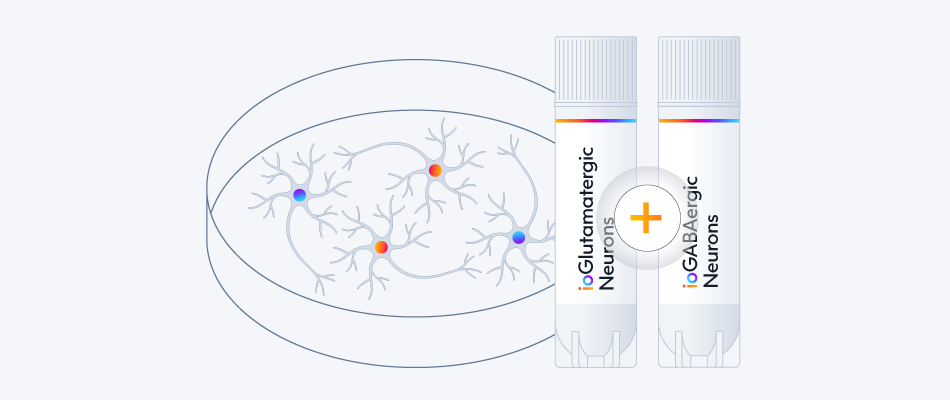
Build neuronal co- and tri- cultures that more accurately represent the complexity of the human brain. Glutamatergic and GABAergic neurons are crucial to help maintain stable ratios of excitatory and inhibitory populations throughout your MEA experiments.
Explore ioGlutamatergic Neurons
Explore ioGlutamatergic Neuron Disease Models

Investigate the impact of the APP V717I (London) mutation on Alzheimer's disease pathology with a functional, rapidly maturing, and disease-relevant system.
ioGABAergic Neurons engineered with the APP V717I (London) mutation demonstrate disease-related phenotype of an increased ratio of A𝛽42:40, as observed in Alzheimer’s disease, when compared to wild-type ioGABAergic Neurons, their genetically matched control.
View the data on the product pages
ioGABAergic Neurons APP V717I/V717I
ioGABAergic Neurons APP V717I/WT
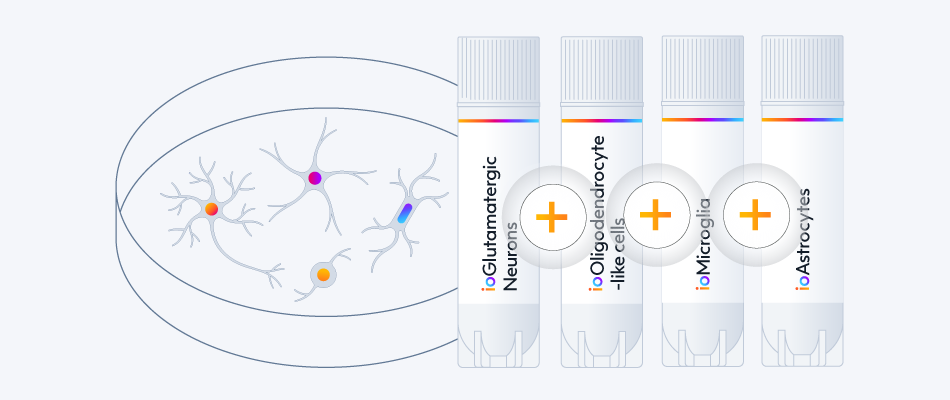
ioGABAergic Neurons are highly pure, defined and consistent, a great companion for your CNS model.
Combine them with other neuronal and glia ioCells to generate complex multi-cell cultures.
ioGlutamatergic Neurons
ioMicroglia
ioAstrocytes
ioOligodendrocyte-like cells
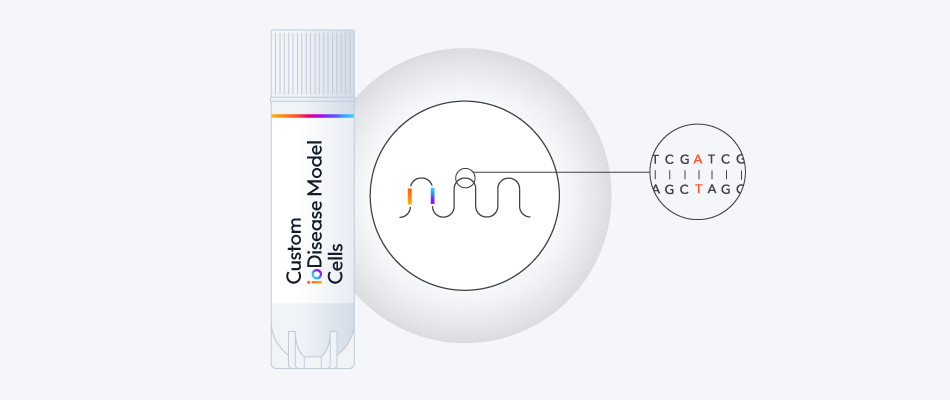
Build your custom disease model or reporter line to pair with wild-type ioGABAergic Neurons as the genetically matched control.
Throughout the custom process, our experts will bring your project to life, and be on hand to support you with any technical queries.
Start the conversation today
Consistent. Defined. Scalable.


